3.5 Interactions
| In the previous section, we saw how the behavior of individual classifiers, such as classes and use cases, can be modeled using statecharts and their close cousins, activity charts. In this section, we will see how the UML models the collaborative behavior of multiple entities working together.[11] Collective behavior, or interactions, concerns itself with the (partially) sequenced exchange of messages (which may be events, operation calls, or instance creation/destruction actions) among a possible large set of interacting objects.
There are three primary diagrammatic forms in the UML for depicting interaction scenarios communication diagrams,[12] sequence diagrams, and timing diagrams. Communication diagrams are basically object diagrams with messages shown, each with a sequence number. Because communication diagrams are relatively little used as compared with their cousin, the sequence diagram, they won't be discussed here. Timing diagrams emphasize the changes in value or state over time for either single or multiple classifiers roles. Timing diagrams are discussed in Section 3.5.2.
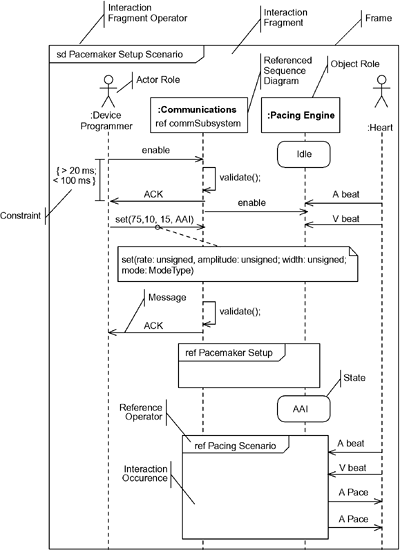
3.5.1 Sequence DiagramsFigure 3-25 shows the basic elements of a sequence diagram. The five-sided box at the upper lefthand corner names the sequence diagram. In general, a sequence diagram contains one or more interaction fragments, each of which is enclosed in a frame and one or more operators. As previously mentioned, sequence diagrams are more commonly used than communication diagrams even though they show basically the same information. The reason is that sequence diagrams emphasize sequence over structure, so it is very easy to find the "next" message it is the message following the current one in the diagram. Time goes down the page, but not normally linearly; that is, further down implies later in time, but 2 cm at one place in the diagram does not imply the same amount of time as 2 cm somewhere else on the diagram. Further, because messages on sequence diagrams are only partially ordered (a topic discussed shortly), in many cases the relative timing between messages is not specified. Since timing diagrams are shown against a common clock (depicted with the time ruler on the diagram), timing diagrams messages are fully ordered. When time, rather than sequence, is the primary focus, I recommend that timing diagrams be used instead. Figure 3-25. Sequence Diagram
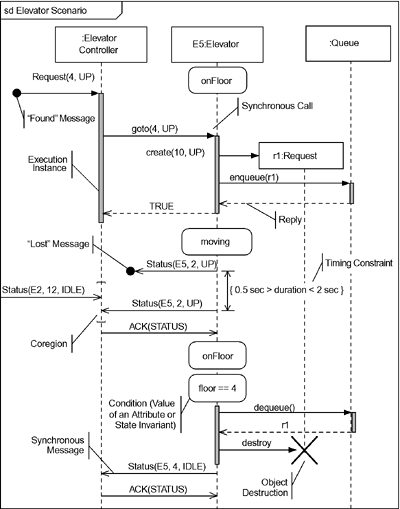
The vertical lines, called lifelines, represent the roles (i.e., parts of a composite class or a object roles in a collaboration) the instances play during a scenario. These roles may be parts of a collaboration and/or internal parts of a structured class, component, or subsystem. Objects roles can send and receive messages during the execution of a scenario. Messages are represented by the arrowed lines going from one lifeline to another. These messages can be synchronous or asynchronous, calls or signals. The frame enclosing the diagram encapsulates an interaction fragment. Each interaction fragment has at least one operator, held in the five-sided box at the upper left corner of the interaction fragment. Section 3.5.1.2 details the standard operators available. The sequence diagram in the figure has other elements that could be found in the sequence diagrams in UML 1.x: constraints, states, messages, and so on. One of the most important differences between UML 2.0 sequence diagrams and UML 1.x sequence diagrams is the ability to decompose interaction fragments into nested interaction fragments. Figure 3-25 has three interaction fragments. The sd operator names the primary interaction fragment, but there are also two nested interaction fragments. The ref operator identifies the name of the sequence diagram that is being referenced, but not shown in the current diagram. Each of these features will be discussed in more detail shortly. There are more annotations available, as shown in Figure 3-26. Messages can be either lost or found. Lost messages are pretty obvious a message is sent, but due to some error or failure, it fails to arrive at its destination. The notation for that is to have the message terminate in a circle. Conversely, a found message arrives from an unknown or unspecified source; this is shown with a message starting from a circle. Figure 3-26. Addition Sequence Diagram Annotations
As with UML 1.x, activation of an instance can be shown, although the UML 2.0 specification refers to this as an execution instance. This is shown with the shaded rectangle placed onto an instance line to show that the instance is actively executing behavior in response to receiving a message. This annotation is really only useful for completely synchronous calls among instances, and I personally tend not to use the notation for that reason. The kind of message may be shown as well. Open arrowheads denote asynchronous messages, while a filled arrowhead indicates a synchronous call. The open arrowhead with a dashed line is optionally used with the call message to show a reply. Replies may also be shown as a return value on the original message, as in
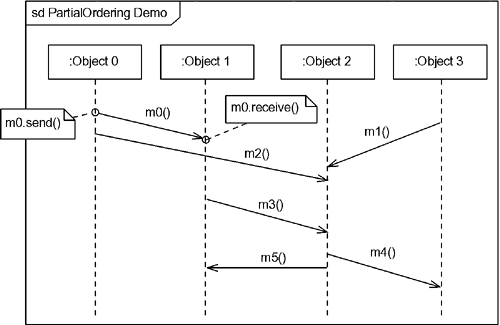
which indicates that TRUE is returned. A large X at the terminal end of a lifeline indicates that the instance has been destroyed. In the figure, we see the Elevator lifeline destroys the request lifeline when the request has been fulfilled. We've already seen that states on the lifelines show the state of the instance playing the role of the lifeline in the interaction. We can use any testable condition, such as the value of an attribute. In the figure, we show how the value of the floor attribute can be shown on the Elevator lifeline. The last new thing shown in the figure is the coregion, an area on the lifeline between square brackets. In a coregion, we do not care about, and do not specify, the order of the messages. This violates the normal partial ordering rules discussed in the next section. A more general way of showing coregions is to use the par operator, as discussed in Section 3.5.1.2.2. 3.5.1.1 Partial OrderingA note on ordering in interactions is appropriate here. Even experienced UML users are often surprised to learn that interactions are only partially ordered. They expect that if a message begins or terminates below another then it comes after the other in absolute time. This is not quite true. Sequence diagrams support concurrent semantics, which means that the relative ordering of some messages is not specified. For example, does message m0 precede m1 in Figure 3-27? The answer is, we don't know, because they begin and end on different lifelines. A sequence diagram shows a trace of message exchange among the lifelines of interest. Sequence diagrams assume concurrency may exist between the lifelines. What concurrency means is that within a concurrent thread, operations are fully ordered, but between concurrent elements, nothing can be said about the relative ordering of operations, except at points of synchronization between the concurrent elements. We can think of each message as being associated with two events one event that sends the message and one event that receives the message, as shown with the constraints for m0.send() and m0.receive() in the figure. The two kinds of sequences that are fully ordered are the events that occur on a single lifeline and the receive() events that follow the corresponding send() events. Figure 3-27. Partial Ordering
This means that in the figure, m0.send() precedes m0.receive(); m1.send() precedes m1.receive() and so on. Further, the events on the Object1 lifeline are fully ordered; m0.receive() precedes m3.send(), which precedes m5.receive(). However, you can't tell from the sequence diagram whether m0.send or even m0.receive() follows m1.send() or m1.receive(). In the sequence diagram shown in Figure 3-27 the following orders can be determined:
But we cannot assume that even messages that are sent in a particular sequence are received in the same sequence, if they terminate on different lifelines. For example, it is clear that m0.send() precedes m2.send() because they initiate from the same lifeline. However, they terminate on different lifelines so one cannot assume that m2.receive() occurs after m1.receive(). If m2.receive() arrives prior to m0.receive(), this is called message overtaking. How can this occur? Imagine that Object 0 and Object 1 both reside on a computer in Mission Control, while Object 2 resides on a probe orbiting Europa. Obviously, message transmission time on the same computer requires orders of magnitude less time that transmission across hundreds of light minutes. Even in more mundane applications, the priorities of different threads can mean that messages sent earlier may still be received later. The problem is further exacerbated with distribution of objects across multiple processors and physical locations. 3.5.1.2 Interaction OperatorsWe have seen that the interaction fragments on sequence diagrams have operators. So far, we've only seen the sd (interaction fragment name) and ref (interaction fragment reference) operators but there are quite a number. The predefined operators are shown in Table 3-2.
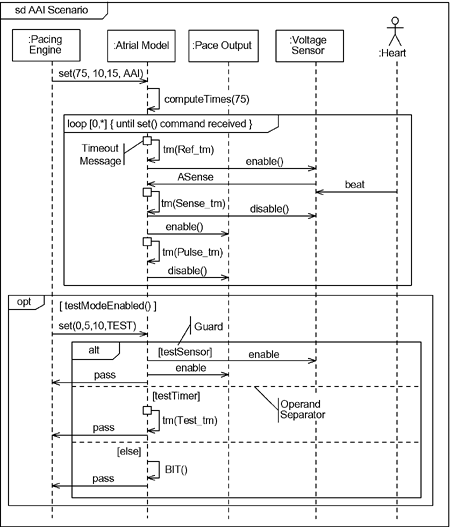
The most important of the operators are discussed in more detail in the text that follows. 3.5.1.2.1 Alternatives, Branches, Options, and LoopsThere are several operators devoted to branching: alt, break, opt, and loop. All (except break) are shown in Figure 3-28. For those readers who remember the (admittedly pathetic) branching capability of UML 1.x sequence diagrams, the alt operator for interaction fragments will be a very welcome addition to the UML. With the alt operator, the fragment (called a compound fragment in this case) is broken up into multiple sections, separated by an operand separator a dashed line crossing the width of the fragment. Guards control which of the alternative branches will be taken. Remember, this is branching, rather than concurrency, so that at most only a single operand fragment will execute. The fragment being operated on by the alt operator in the figure has three operands, each with a separate guard. The [else] guard is TRUE if and only if the other guards are all FALSE. If all the guards of an alt operator are FALSE, then none of the operands will execute; if multiple guards are true, then one of the operands guarded by a true guard will execute but you cannot predict which one it will be (normally an undesirable situation). Figure 3-28. Loops and Branches
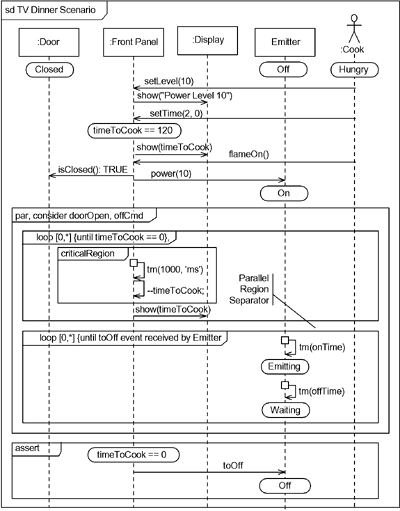
The opt operator is like an alt with a single operand it designates its fragment as being optional. Loops are shown with the loop operator. The loop operator may specify the minimum number of iterations as well as the maximum number of iterations inside square brackets. If no numbers are specified, then [0, *] is assumed, where the asterisk (*) is indeterminate. If only the first number is given, then the fragment will iterate a fixed number of times. By adding a constraint, we can limit the number of times the fragment will execute. In the figure, we indicate that the specified fragment will iterate until a set() command is received by the pacing engine. Note also the special notation used for a timeout message. While not officially part of the standard, it is often useful to indicate timeouts as special. They are shown as a "message to self" initiating from a small square. A cancelled timeout (not shown) has the same notation, except that the message arrow is dashed. 3.5.1.2.2 Parallel and Critical RegionsIf alternatives were painful to show in UML 1.x sequence diagrams, parallel regions were well nigh impossible. UML 2.0, however, makes specifying parallel regions on sequence diagrams easy. The par operator indicates two or more parallel regions, but otherwise looks much like the alt operator. In Figure 3-29, two parallel regions are shown for the microwave oven. The consider operator (discussed in the next section) indicates that these messages have special meaning and should not be ignored should they occur. Inside each of parallel regions is a loop; the first specifies an unlimited number of iterations but is constrained to terminate when the attribute timeToCook reaches zero. The second doesn't specify a terminating condition. The par operator is a more general (and useful) form of the coregion operator shown in Figure 3-26. Figure 3-29. Parallel Regions
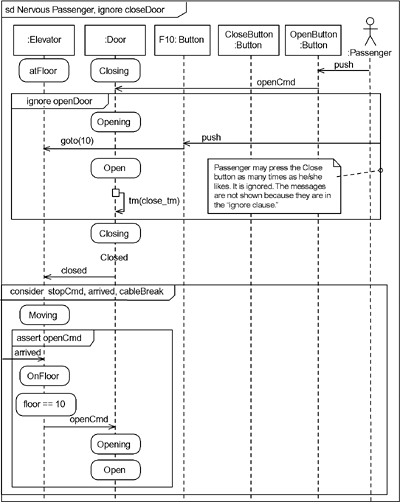
Also notice the critical region in one of the parallel regions. This has the same meaning as a critical section in normal concurrency programming that is, traces of execution of this fragment cannot be interleaved with other possible concurrent fragments. Normally, a critical Region fragment is nested within one of the parallel regions as it is in the figure. The assert operator indicates that this must be true for the trace to be considered valid. This essentially adds causality to sequence diagrams and allows them to be used to specify test vectors. The assert operator is discussed more in the next section. 3.5.1.2.3 Assert, Consider, Ignore?UML 1.x sequence diagrams really don't have any notion of causality they are merely traces of what happened or what could happen during an interaction. They don't specify what must happen. David Harel and Werner Damm [5] have done some work on adding the notions of causality to sequence diagrams. These notions have been added, although in a somewhat different form, to the UML 2.0 sequence diagrams with the consider, ignore, and assert operators. The ignore operator lists messages, as parameters, that are outside of the causal stream and may be ignored. For example, consider the ignore operator in Figure 3-30. It says that while the Door is opening, presses to the open button (resulting an OpenCmd) are ignored, which is behavior you would expect. Figure 3-30. Assert, Consider, Ignore?
Also note that the sd and ignore operators are combined in the primary fragment shown in the diagram. This indicates that pressing the CloseButton has no effect on the scenario.[13]
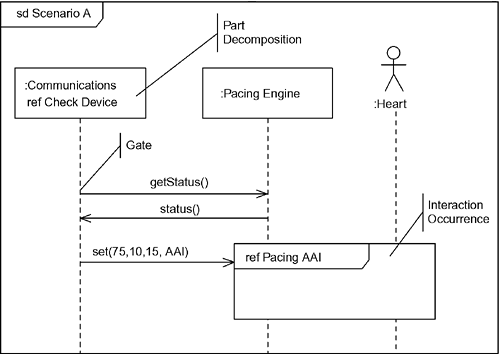
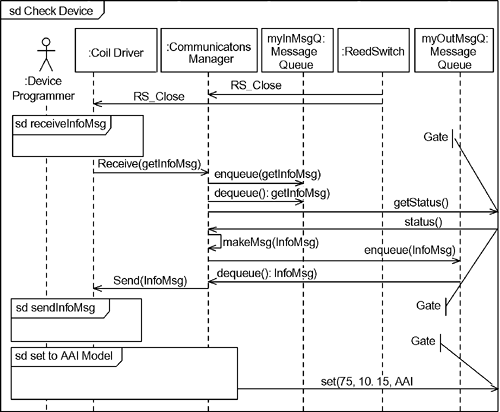
In the lower part of the figure, the consider operation is used. Consider is the opposite of ignore. It considers the specified messages (in this case, stopCmd, arrived, and cableBreak) are the important ones, and all other messages may be ignored. Finally, the assert operator is used inside the consider fragment. The proper interpretation of this fragment is that an openCmd must follow the arrived message. 3.5.1.3 Sequence Diagram DecompositionProbably the most significant improvement in sequence diagrams with UML 2.0 is the ability to decompose the diagram into subparts. UML has always had the ability to do this with class diagrams and statecharts, but sequence diagrams lacked a standard way to do such decomposition. This feature is crucial for effective large-scale systems development because such interactions become complex in at least two ways. First, many more interacting elements become added to interactions as designs evolve and are elaborated. In class diagrams, this is handled by using structured classes and composition relationships and by showing only the internal structure of the larger-scale objects. The second way that sequence diagrams become more complex is that more messages, more alternatives, and more variants are added. The addition of operators, such as alt and par, help this problem tremendously, but there is still a need to move all the details of an interaction and show it on a separate diagram. This might be done to manage a complex scenario as well as when the same sequence may be referenced from more than one interaction fragment. UML 2.0 sequence diagrams allow this kind of decomposition in two ways: referencing interaction fragments and decomposing lifelines. Figure 3-31 illustrates both means of decomposing sequence diagrams. The lifeline Communications is decomposed in the interaction fragment called Check Device. The decomposed interaction is shown in Figure 3-32. The decomposed lifeline includes more lifelines than the first. This is one of the advantages of such decomposition it allows us to manage the burgeoning complexity of our sequence diagrams as more and more lifelines are added. In addition, the Check Device fragment itself includes interaction occurrences that reference interaction fragments shown elsewhere. This allows us to hide the details of the "bit banging" done during the actual transmission and reception of the bits with the CoilDriver. Lastly, we see that message enter and leave this interaction fragment. Each point on the frame where a message enters or leaves is called a gate. To be well formed, the referenced fragment must a corresponding gate for every gate that appears in the interaction occurrence, and the message type and parameters must be consistent as well. Figure 3-31. Referencing Sequence Diagram
Figure 3-32. Lifeline Decomposition
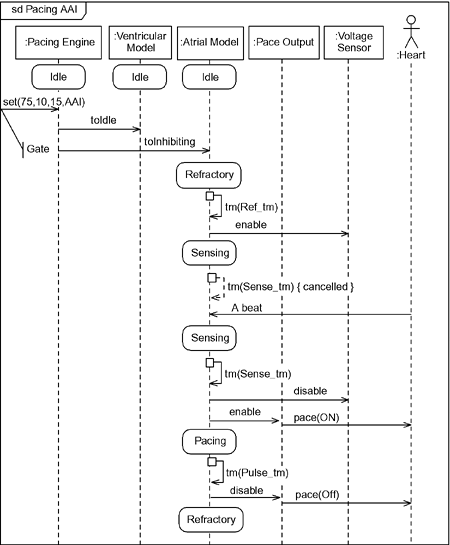
The other kind of decomposition is to have an interaction occurrence that references a separately defined interaction fragment. In Figure 3-31, this is the nested fragment called Pacing AAI. The internal structure of that interaction appears in Figure 3-33. Just as in the previous decomposition, this fragment details the internal structure of the interaction and may add additional lifelines as necessary. Figure 3-33. Referenced Interaction Fragment
Clearly, these means for decomposing sequence diagrams allow us to construct and understand complex interactions far better than the sequence diagrams from UML 1.x. 3.5.2 Timing DiagramsElectrical engineers have used timing diagrams for a long time in the design of electronic state machines. A timing diagram is a simple representation with time along the horizontal axis and object state or attribute value along the vertical axis. Of course, electrical engineers usually only concern themselves with a small number of states for an individual circuit node, such as low, high, or high impedance.[14] Software engineers can use timing diagrams just as easily on much more elaborate state machines or many-valued attributes to show how the values change over time.
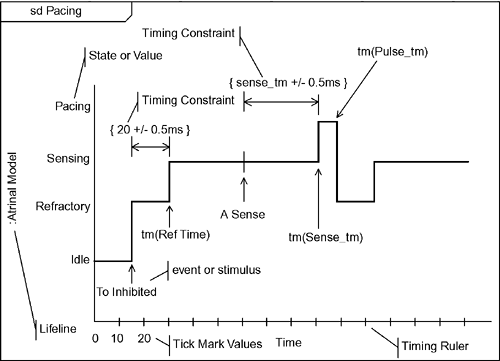
Timing diagrams are similar to sequence diagrams in that they show traces, or scenarios, of collaborations. Many different traces are possible with the same collaboration. This is different than statecharts in that statecharts specify all of the reactive behavior of the classifier it is specifying. Timing diagrams depict state (or value) as a horizontal band across the diagram. When the system is in that state, a line is drawn in that band for the duration of time the system is in the state. The time axis is linear, although special notations are sometimes used to indicate long uninteresting periods of time. The simple form of a state timing diagram is shown in Figure 3-34. Figure 3-34. Simple State Timing Diagram
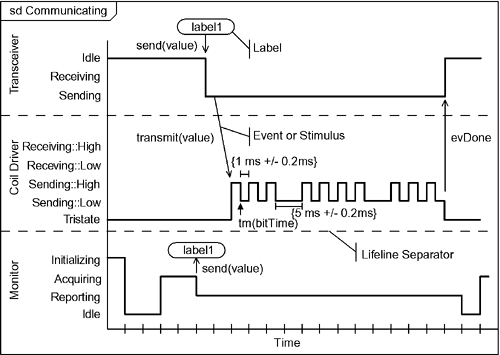
This timing diagram shows a particular path through the Atrial Model state machine. It begins in the Idle state and remains there until it receives a command to enter begin pacing (To Inhibiting). At this point, it jumps to the sensing state. The vertical line segments connecting states show that the time used for the transition is (approximately) zero relative to the scale of the timing diagram. Later, an atrial sense is detected (as shown by the transition annotation on the diagram) and the Atrial Model returns to the sensing state. Sometime later, the sense timeout occurs and the Atrial Model enters the pacing state. In this state, the engine is actively putting an electrical charge through the heart muscle. When the pacing pulse width is complete, the object transitions to the refractory state. Once this times out, the system reenters the sensing state. The timing diagram view is preferred to the sequence diagram view when time is of critical importance, as opposed to sequence. We see constraints and other annotations on the timing diagram. Constraints are useful to help specify the timing requirements. For example, the timing for the transition from the refractory state in Figure 3-34 might be 19.6 ms, in this particular scenario, but this is within the required time window of 20 +/- 0.5 ms. In this simple form, only a single object (or system) is represented. It is possible to show multiple objects on the same diagram. Separating these objects with operand separator lines clearly delineates the different (and possibly concurrent) objects. Propagated transitions can be marked with directed lines showing event dependency. Figure 3-35 shows just such a diagram depicting a scenario of collaboration among three objects involved in the transmission of telemetry. We see the collaboration unfold as they exchange messages. When it is inconvenient to draw the message from one lifeline directly to another, labels can be used, as with the case of the send(value) message. Figure 3-35. Timing Diagram with Multiple Lifelines
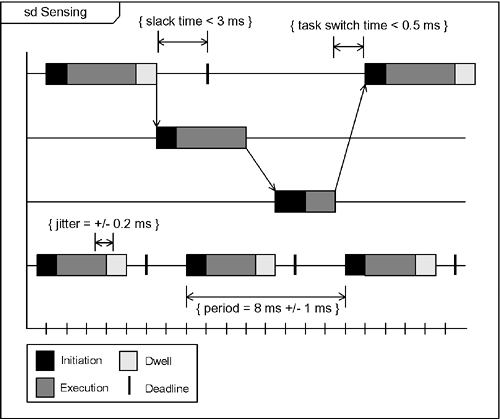
Timing diagrams are very good at showing precise timing behavior and are often used to closely analyze the timing of periodic and aperiodic tasks. When used in this way, some common elements are shown in Table 3-3.
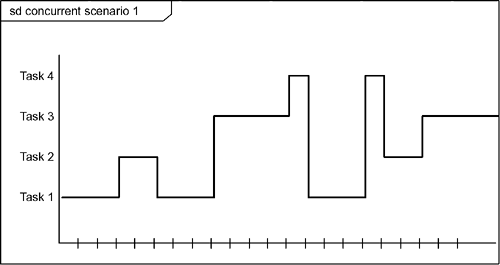
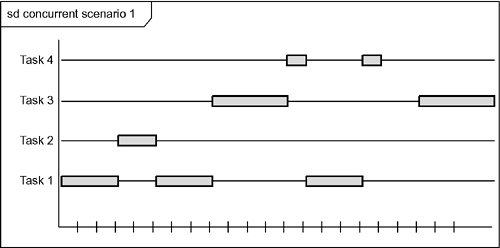
When there are many tasks to be shown on a single diagram, a common simplified form of the timing diagram shows only which task is executing at any point in time (see Figure 3-36).[15] If desired, more details of the task state can be shown with pattern shading, as in Figure 3-37. Although timing diagrams show no information beyond that available in annotated sequence diagrams, the absolute timing of events and state changes and the relative timing among objects is much clearer and more obvious than on sequence diagrams, even when explicit timing constraints are added.
Figure 3-36a. Simple Task Timing Diagram (standard)
Figure 3-36b. Simple Task Timing Diagram (alternative)
Figure 3-37. Task Timing Diagram with Shading
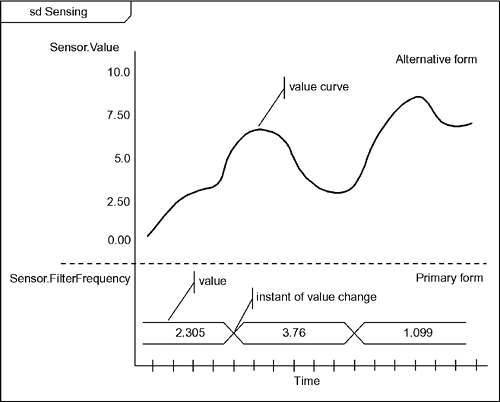
Lastly, timing diagrams can be used to show the values of attributes. Commonly, timing diagrams are used to show the changes in values of discrete enumerable attribute values, but they can also be used for continuous values, as shown in Figure 3-38. The "preferred" form, shown at the bottom of the figure, is appropriate when a value is changed in respond to a change event at some specific point in time. The attribute holds the value until the message is received and the value is (discontinuously) modified. For systems or continuous modeling, this format may not be very helpful, so a second notation is recommended in these cases, shown in the upper part of the figure.[16]
Figure 3-38. Timing Diagram with Continuous Values
|
EAN: 2147483647
Pages: 127
