Creating Multicolumn Reports
The samples presented so far in this chapter do not present classic database reports that display multiple columns from one or more underlying tables. You can create this kind of report in at least two ways: using the Report wizard and using manual layout techniques.
Using the Report Wizard
The Report wizard, which has an interface similar to the Simple Query wizard, lets you create a multicolumn report. Figure 6-9 shows a report prepared using the Report wizard. As you can see, the wizard provides a lot of computations. The report's underlying record source counts sales quantity and sums extended price by product for each customer. The report also sums the order quantities and prices by customer and overall customers. It then uses these results to compute the percent of total sales and extended price for each customer. It also sums the number of records for each customer and prints a one-line message with the customer's name and its record count.
The Report wizard can add a flurry of formatting touches as well. Figure 69 shows one set of choices. Using spacing and horizontal lines, the layout distinguishes the report's title from the rest of the report. You can also choose from several different field layouts. The layout in the figure places the grouping variable—CompanyName—on the far left of report pages. Note that that this layout required no code.
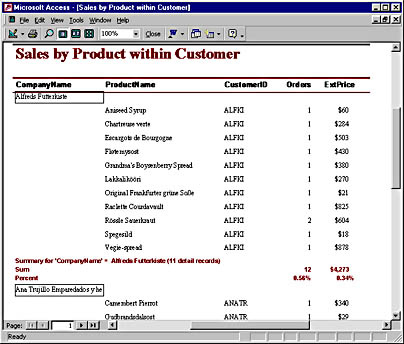
Figure 6-9. This excerpt from a report shows some of the Report wizard's calculations and formatting options.
Creating a Custom Report
When you need a special arrangement of controls on a report as well as unique computations, you must lay out the report manually. Figure 6-10 shows excerpts from a custom report whose functionality is similar to the report in Figure 6-9. This custom report has simpler formatting to make it easier to follow. The top window shows the sales by product for a customer along with the sums for order quantities and extended price and the percentages of the grand total for both items. The bottom window shows the continuation of the report for the second customer. The Page Footer section shows the date of the report, the current report page, and the total number of pages.
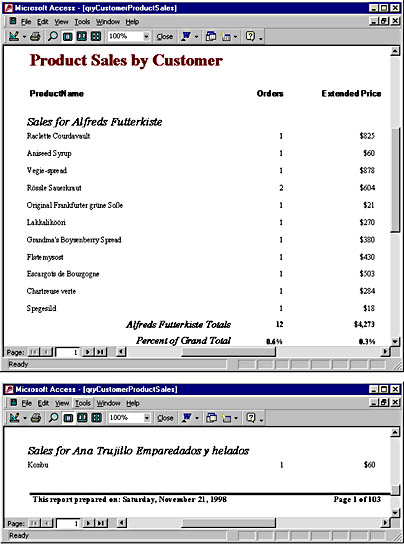
Figure 6-10. Excerpts from a custom multicolumn report.
Figure 6-11 shows the Design view of the report in Figure 6-10. Nearly all the controls on the report are labels or text boxes. You should generally assign string constants to labels and set their caption property to the string constant. The text in the Report Header section is in a label.
Controls that display numeric fields or string expressions are always text boxes. The first string expression appears in the CompanyName Header section. It is a concatenation of a string constant and the CompanyName field in the report's record source. The Detail section appears next. Its three text boxes each reference a field. Since these controls do not combine the field into an expression, there is no need for a leading equal sign (=) or for placing the field name in brackets.
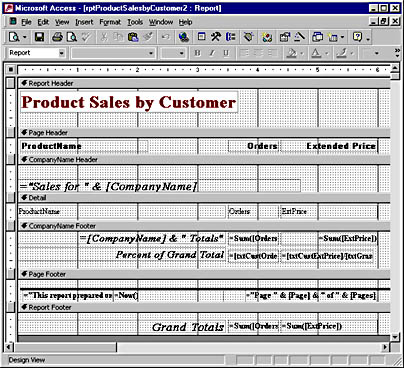
Figure 6-11. The report in Figure 6-10 in Design view.
The four right-hand controls in the CompanyName Footer section contain expressions for computing the sum of sales orders and extended price for each customer, along with each customer's percentage of the total sales quantity and extended price. The following table shows the control names and their expressions. The expressions for the percentages rely on two controls that appear in the Report Footer sections, txtGrandOrders and txtGrandExtPrice. These controls compute the total sales quantity and extended price across all customers.
Expressions for Sums and Percentages in Figure 6-11
| Control | Expression |
|---|---|
| txtCustOrders | Sum([Orders]) |
| txtCustExtPrice | Sum([ExtPrice]) |
| txtOrdersPercent | =[txtCustOrders]/[txtGrandOrders] |
| txtExtPricePercent | =[txtCustExtPrice]/[txtGrandExtPrice] |
| txtGrandOrders | =Sum([Orders]) |
| txtGrandExtPrice | =Sum([ExtPrice]) |
The sums for individual customers and the grand total refer directly to the underlying field values, Orders and ExtPrice. The percentage calculations for individual customers refer to control names that, in turn, depend on field values.
NOTE
By default, Access gives a text box control the same name as the field to which it binds. To avoid confusion, you can give the controls different names. For example, if a field name is Orders, you can change the name of a text box control that references it to txtOrders. This makes it easy for you to read expressions and determine whether they reference a field value or a control.
Notice in Figure 6-10 that the date of a report prints at the bottom of a page, but there is a leading string constant. If you want to apply a format, such as the Long Date format, you must isolate the Now function in a text box by itself. Figure 6-11 shows two concatenated text boxes containing the leading text string and the trailing formatted value of the Now function.
The right side of the report shown in Figure 6-11 uses two keywords, Page and Pages, that identify the current report page and the total number of pages in the report. (These keywords do not appear in the figure.) Notice that you can include these keywords in string expressions.
EAN: 2147483647
Pages: 97