The Benefits
| Now we'll move to calculating the benefits of managing use cases with a requirements management tool. Of the categories of benefits discussed previously, increased or retained sales and reduced operating costs, the model will focus solely on reduced operating costs for the company. This is fairly common for most IT investment ROI models. In the case of a requirements management tool, one could probably make an argument that increased sales, or at least retention of sales, are realized due to increased customer satisfaction resulting from better requirements management. Savings from Staff Working more EfficientlyWe begin by calculating the savings realized from staff on projects having a readily available, always up-to-date, common source of use cases upon which they can base their work. It is a cost reduction from staff working more efficiently to plan, develop, test, document, and develop training materials for a product (see Figure 7.6). Figure 7.6. Savings from staff working more efficiently.
Scenarios where inefficiencies occur when use cases are not readily available to staff include:
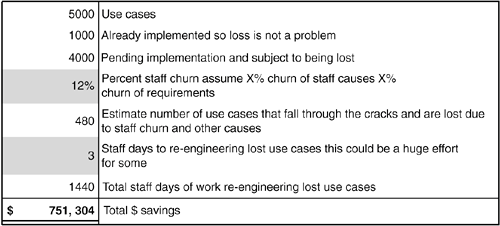
Note that this part of the model is not about doing a better job; it's about doing the same job more efficiently. This is, again, a highly subjective number, objective numbers being difficult to come by. In talking with staff members that were using the tool, all agreed there was a savings in time, but how much varied. One way to use a model such as this one is to pick a number that is so low that everyone automatically is willing to buy into it, and then use the model to show how even that little savings translates into big dollars accrued over large numbers of use cases and staff. As illustrated here, just a savings of 1.5 hours (representative of responses I got from staff) per team member adds up to large savings. Savings from Avoiding the Cost of Lost Use Cases from Staff ChurnStaff churn is a common problem for maintaining project consistency over time. Staff members quit the company; staff members move to other projects or are promoted; whole projects get re-staffed through company reorganization. When use cases are not recorded and managed in a company-wide system, they are subject to loss due to staff churn. The loss means that the use case must be "rediscovered" and re-engineered again and again. Figure 7.7 models the savings in avoiding the cost of lost use cases due to staff churn based on 12% staff churn per year reported by some HR groups. Figure 7.7. Savings from avoiding lost requirements.
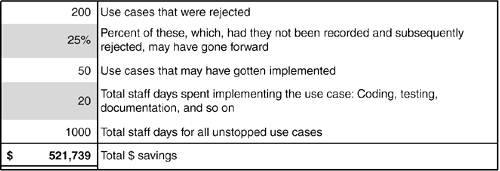
And of course, staff churn is only one way in which use cases can be lost over time if not under some formal means of configuration management. Use cases recorded on white boards are erased; use cases recorded on laptops are lost when the laptop is stolen; use cases, like socks in a dryer, can just disappear! Savings from Avoiding Cost of Unnecessary DevelopmentOne of the benefits of a company-wide requirements management tool is the increased visibility that use cases receive. The people on various projects are able to see what others are doing; redundancy, conflicts and misunderstandings are spotted; and priorities are better managed. The result: use cases get rejected! This leads to a cost savings in avoiding work on use cases that are rejected due to increased visibility in the company (see Figure 7.8). Figure 7.8. Savings from avoiding cost of unnecessary development.
Savings from Reducing the Cost of Requirements-Related DefectsFinally, let's look at the cost savings in terms of fixing requirements related defects. For this part of the model, we'll use a few concepts also used in doing inspection ROI assessments (Weller 2002). We'll do this by:
In the following, a "requirements defect" is a defect in the use case itself, either of commission (e.g., the use case said "X" but should have said "Y") or omission (e.g., the use case didn't say anything about "X" but very well should have). It's almost an industry clichE9 that the later a defect is found in the development life-cycle, the higher the cost to fix. The relative amount of the increase varies from industry to industry. Here I use a simple three-phase defect-removal model:
The relative cost of fixing defects will be 1 staff day, 5 staff days, and 25 staff days, respectively, an increase of a factor of 5 from phase to phase, well below averages that are cited in the literature.[8]
Baseline Estimate: Cost of Requirements Defects without Tool SupportNow let's look at the model. We start by estimating the number of requirements-related defects (see Figure 7.9). Unless we are willing to acknowledge the possibility of a perfect use case, it's safe to assume that all the use cases have at least one defect, on average. If you are not comfortable with that assumption, adjust the percent as needed. Figure 7.9. Estimating number of requirements-based defects.
Next, we estimate the number of requirements-related defects removed prior to commitment to code and the associated cost (see Figure 7.10). A removal effectiveness of 50% means that of the total population of defects, 50% were caught and fixed. We'll assume that, on average, a defect at this stage can be found and fixed in one staff day; changes that don't involve code are simply cheaper to make. Figure 7.10. Cost of requirement defects removal prior to being committed to code.
In Figure 7.11, we estimate the number of requirements-related defects removed from the code itself (e.g., unit, integration, and system test) and the associated cost. The calculation starts with the number of defects that remain undetected and unfixed from the previous stage. Because we are now dealing with code, the cost of finding and fixing a defect rises from one staff day per defect to five staff days per defect. Note that this is the total cost in staff effort incurred, including testers, developers, and configuration management. Figure 7.11. Cost of requirement defect removal from code.
At this point, let's review the total defect removal effectiveness of the first two stages (see Figure 7.12). Figure 7.12. Defect removal effectiveness.
Defect removal effectiveness (DRE) is a measure of the effectiveness of a development process to detect and remove defects.[9] DRE = total defects found and fixed, divided by total number of defects. In this case, we have 900 found and fixed (500 from Figure 7.10 + 400 from Figure 7.11) over a total of 1000 to start with (Figure 7.9) for a DRE of 90%; an acceptable value for the industry. The point of computing this is to make sure that our model isn't skewed with a low DRE, thereby resulting in an unusually high number of the defects being caught in the last, most expensive phase of detection (i.e., after release).
Finally, we calculate the cost of defects shipped with the product to the customer (see Figure 7.13). At this stage, "finding" the bug is not so much a factor in the cost; the customer does that for you! Now the cost of defects is determined by factors such as customer support calls, loss of sales from unhappy customers, and the increased cost to patch software in the field. The cost of defects at this point varies greatly depending on the industry; safety-critical products are an example of where the cost can be very high. Figure 7.13. Cost of requirement defect removal after product ships.
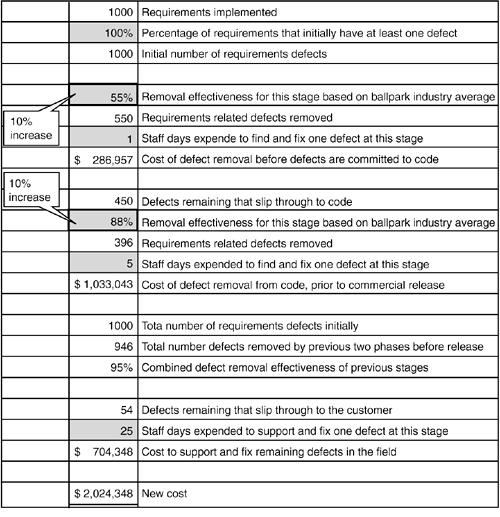
Our baseline costthe cost before introducing a requirements management tool and processfor finding, supporting, and fixing requirements-based defects in use cases is $260,870 (Figure 7.10) + $1,043,478 (Figure 7.11) + $1,304,348 (Figure 7.13) = $2,608,696. New Estimate: Cost of Requirements Defects after Tool SupportNow we rerun the baseline, but with a 10% increase in defect removal effectiveness at each of the first two stages (the third stage, where your customer finds the requirements defects for you, will not benefit from improvements due to a requirements management tool and process).[10]
So if our first phase of defect removal involved removing 500 defects (refer to Figure 7.10), we would expect to find 10% more defects now (i.e., 550 defects removed). This works out to a new DRE of 55%: 550 found / 1000 total.[11] The improvement in defect removal effectiveness is due to the added review and rigor we paid for previously in Figure 7.5.
Figure 7.14 shows the new figures. The new cost of defect removal is now calculated at $2,024,348; a cost savings of $584,348 over the old cost of $2,608,696. Figure 7.14. Cost of defect removal after 10% improvement in defect removal effectiveness due to improved requirements management tool and process.
|
EAN: 2147483647
Pages: 109


