Monitoring System Behavior
Throughout this book, we've looked at statements that are useful for monitoring some aspect of SQL Server's performance. These include procedures such as sp_who2, sp_lock, SET SHOWPLAN_TEXT ON, DBCC SQLPERF, and various trace flags for analyzing deadlock issues. SQL Server Enterprise Manager provides a graphical display that is a combination of sp_who2 and sp_lock, and you should make use of it. In addition, two other tools let you monitor the behavior of your SQL Server system: SQL Profiler and System Monitor (Performance Monitor in NT).
SQL Profiler
SQL Profiler has been completely rewritten for SQL Server 2000 because of the need to absolutely guarantee that no trace records will be lost under stress. SQL Server 2000 must support C2 auditing, and losing any trace information is unacceptable if auditing is enabled. In addition, if records are missing, it is much more difficult for Product Support to use SQL Profiler for reproducing problems.
History of SQL Profiler
The original tracing tool, which appeared in version 6.5, was called SQL Trace and was basically an "ODS Sniffer." SQL Trace was itself based on an earlier freeware product called SQLEye. SQLEye was essentially a filter that listened on the network using the ODS API for all the batches that were sent to a specified SQL Server. When SQLEye received an incoming batch, it could apply one of several filters to it and record in a file all batches that satisfied the filters' conditions. In version 6.5, the same developer who wrote SQLEye put a GUI wrapper around its configuration and specification commands and created the SQL Trace tool.
Because SQL Trace worked only at the ODS layer, it could capture only the commands that were actually being sent to SQL Server. Once SQL Server received the command, SQL Trace had no further knowledge of what SQL Server did with it. For example, if a client connection sent a batch to SQL Server that consisted of only a stored procedure call, that is all SQL Trace could capture and record. It could not record all the statements that were executed within the stored procedure, and it had no knowledge of other procedures that were called by the original stored procedure.
SQL Profiler in versions 7 and 2000 belongs to a new generation of profiling tools. Not only can it keep track of every statement executed and every statement within every stored procedure, but it can keep track of every time a table is accessed, every time a lock is acquired, and every time an error occurs.
Tracing in SQL Server 2000
SQL Server 2000 divides the tracing functionality into two separate but connected components. On the server side is the SQL Trace facility, which manages queues of events generated by event producers. A consumer thread reads events off of the queues and filters them before sending them to the process that requested them. Events are the main unit of activity as far as tracing is concerned, and an event can be anything that happens inside SQL Server, or between SQL Server and a client. For example, opening a table to access its data is an event, executing a stored procedure is an event, and sending a T-SQL batch from a client to the SQL Server is an event. There is a set of system store procedures that you can use to define which events should be traced, what data for each event you're interested in, and where you want to save the information collected from the events. You can specify filters to apply to the events in order to reduce the amount of information collected and stored. We'll see some examples of the use of these procedures later in this section.
Figure 17-3 shows the general architecture of the SQL Trace server component. (Event producers are server components such as the lock manager, buffer manager, and ODS, which generate the events recorded in the queue.)
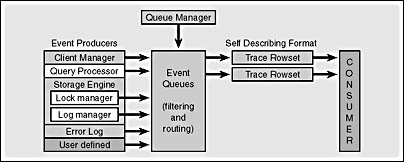
Figure 17-3. The SQL Trace architecture.
As an alternative to using the system procedures to define the events to trace, you can use the client-side component called SQL Profiler. Using this tool, you can select the events and data columns from a list and then specify how you want to filter the events. The tool then displays every event that meets your criteria as it occurs.
You incur a lot more overhead when you use SQL Profiler to capture and save events. The server-side consumer thread returns OLE-DB row sets to the client-side consumer, and then SQL Profiler must display the data from the row sets appropriately. To reduce the amount of data sent from the server to the client, each row contains only a minimum amount of information—basically an event code, a data column code, and a value for that data column. For example, if through SQL Profiler we have asked to keep track of the text of every single stored procedure when it completes and we want to know what time it completes, how much time it took to execute the procedure, the name of the procedure, and the login ID of the user who executed it, the server trace will send multiple rows to the client every time a stored procedure completes. Each row will contain the event code (43 for Stored Procedure Completed events) and one of the requested data column codes. There will be one row for the text (the name) of the procedure call, one row for the end time, one row for the user's login name, and so forth. There will be other rows for data columns we didn't explicitly request because a set of default data columns is returned with every trace. SQL Profiler must read these rows and pivot them to produce one row for each event for display purposes.
When you configure the client-side trace using SQL Profiler, you can choose to save the captured data to a file or a table, in addition to displaying it in the Profiler UI. Once you save trace data, you can again use SQL Profiler to read the saved data for display or analysis purposes. Figure 17-4 shows the client-side architecture. The controller can either get the data from the consumer, which received currently active trace information from the server, or it can read data from a saved location, such as a table or a file. On the left, you can see all the different data sources that can be read. SQL Server 2000's Profiler can read trace data saved with the SQL Server 7 Profiler, and it can read script files saved using the trace facility in SQL Server 6.5.
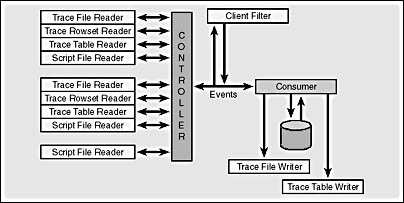
Figure 17-4. The SQL Profiler architecture.
SQL Server 2000 provides more than 100 predefined events, and you can configure 10 additional events of your own. SQL Profiler is more than just the user interface that is available through the SQL Profiler icon. You use the interface for defining traces from a client machine, watching the events recorded by those client side traces, and replaying traces. SQL Profiler can also define server-side traces that run invisibly, using extended stored procedures. One of the advantages of server-side traces is that they can be configured to start automatically. We'll see more on server-side traces later.
Defining a Trace
We'll look at how to define a trace by using the SQL Profiler interface, but the details regarding the types of events, data elements available, and filters are equally applicable to server-side traces defined using the system stored procedures. To start a new trace, choose New and then Trace from the File menu in SQL Profiler. You'll be asked to log in to a particular SQL Server, and then you'll see a dialog box like the one shown in Figure 17-5, with four tabs for defining the trace properties. Alternatively, you can choose File/Open/Trace Template, and then select from 8 predefined trace definitions. You'll get the same tabbed dialog box, but much of the information will be predefined. From the File menu, you can also open a saved trace file or a trace table that you saved previously.
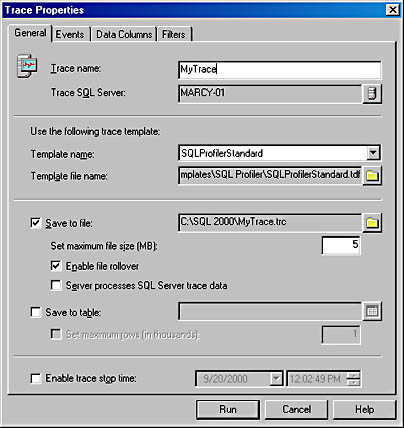
Figure 17-5. The Trace Properties dialog box.
General Tab
When you define a new trace, you give the trace a name and select the SQL Server you want to monitor. The default is the server that you just logged on to, but you can select another SQL Server. You can choose to base your new trace on one of the existing templates by specifying either the name of a template or the file location where the template is stored. Optionally, you can save the information to a file while it is being captured. The file can be processed from either the client or the server. If it is processed from the client (SQL Profiler), each row is processed individually. Writing to a server-side file is done using the same mechanism as log writes use, and the file is opened for pure sequential writing. You can set a maximum file size in megabytes, and you can configure the trace for automatic file rollover. This means that when the file reaches the maximum size you specified, SQL Server will automatically start a new file with a numeric suffix added to the name. This allows the trace files to stay smaller and be managed more easily. Finally, you can set the trace to stop at a specified time; it will start as soon as you click the Run button.
If you use the SQL Profiler interface to create a server-side file, two traces are actually created—one on the server to write to the file and one on the client for display purposes. This does not mean that the events are raised twice; they're raised only once, and the queue filter will manage the fact that there are two subscribers for the same information.
Events Tab
On the Events tab, you can select from over 100 available events, which are grouped into 13 categories. You can select an entire category or select events from within a category. The online documentation gives a complete description of each event. The Events tab is shown in Figure 17-6.
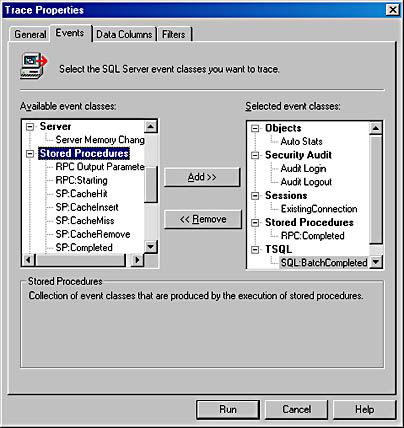
Figure 17-6. The Events tab of the Trace Properties dialog box.
Data Columns Tab
You can specify which data items you want to record for each event. For example, you might want to keep track of only the SQL Server user, the application being used, and the text of the SQL statement being executed. Or you might want to record performance information such as the duration of the event, the table or index accessed, the severity of an error, and the start and end time of the event. Three data elements—BinaryData, IntegerData, and EventSubClass—have different meanings depending on what event is being captured. For example, if you're capturing the Execution Plan event, BinaryData reflects the estimated cost of the query and IntegerData reflects the estimate of the number of rows to be returned. If you're capturing the Server Memory event, EventSubClass data can be 1, which means that the server memory was increased, or it can be 2, which means it was decreased. The IntegerData column reflects the new memory size in megabytes. Not all events have meaningful values for every possible data element. Again, details are available in the online documentation, but they might be a little hard to find. Figure 17-7 shows you where in SQL Server Books Online you can find the details. The figure shows the section on Monitoring Server Performance And Activity, which is in the Administering SQL Server volume. Under Monitoring With SQL Profiler Event Categories is a section for each different category. The figure shows the Performance Event Category, and the right pane shows the top part of the article on Performance Data Columns. The table displays the meaning of the data columns for each possible event. For the Degree Of Parallelism1 Event Class, the EventSubClass column indicates the type of operation being performed, the IntegerData column indicates the pages used in memory for the query plan, and the BinaryData column indicates the actual DOP.
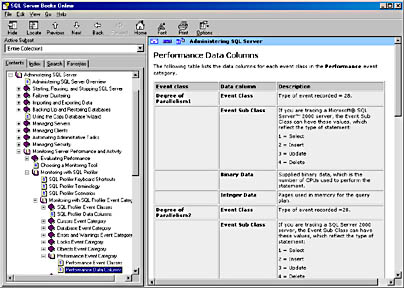
Figure 17-7. Finding the details of each of the data columns in Books Online.
It might seem strange that there are four different events for degree of parallelism, but this is necessary for backward compatibility, so that SQL Profiler can be used to trace activity on a SQL Server 7 server. If you are tracing events on a SQL Server 2000 server, all four events will provide the same functionality (for example, any of the four can be used to get the same DOP information). If you are tracing a SQL Server 7 server, each DOP event will trace only one kind of DML statement: Degree Of Parallelism1 traces INSERT statements, Degree Of Parallelism2 traces UDPATE statements, Degree Of Parallelism3 traces DELETE statements, and Degree Of Parallelism4 traces SELECT statements. The Data Columns tab is shown in Figure 17-8.
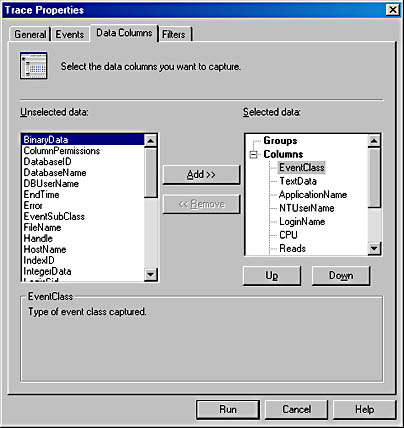
Figure 17-8. The Data Columns tab of the Trace Properties dialog box.
NOTE
The companion CD includes a spreadsheet called SQL Trace Event Summary.xls that lists each possible event, its event ID, and the data columns available for that event.
Filters Tab
Using the Filters tab, you can filter out events that aren't of interest. Two types of filters are available—string filters and numeric filters. Each data element can be filtered in only one of these ways. For data values that are strings, such as ApplicationName or DatabaseName, you can apply a pattern matching string using either LIKE or NOT LIKE, and wildcards are allowed. For example, if I want to trace events only from databases that have history in their name, I can supply a filter LIKE '%history%'. Of course, I also have to capture the DatabaseName column in order to have this filter available. For numeric values such as DatabaseID or Duration (in milliseconds), you can apply filters that check for the data being equal to, not equal to, less than or equal to, or greater than or equal to. For example, if I want to trace only events that took longer than 1000 milliseconds to execute, I can set the Duration filter to 'greater than or equal' 1000. For data that represents datetime values, only the greater than and less than filters are available.
By default, all traces exclude events originating from SQL Profiler because typically you don't want to trace the events that are involved in the actual tracing. Figure 17-9 shows the Filters tab of the Trace Properties dialog box.
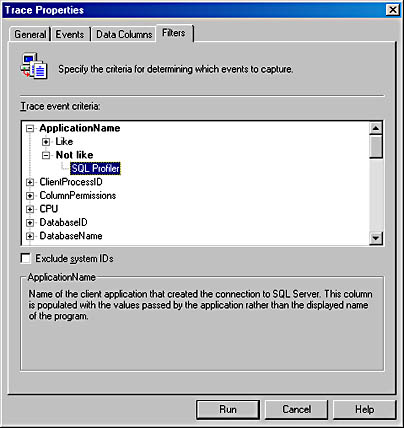
Figure 17-9. The Filters tab of the Trace Properties dialog box.
The online documentation provides full details of all the filters and describes which data elements allow which filters. Note that you can supply multiple values for a condition. For example, if you want to trace events that occur only in databases with ID 5 or 6, you can enter both 5 and 6 under the Equals condition.
The Filters tab includes a check box labeled Exclude System IDs. Checking this allows you to capture fewer trace events by excluding most of the events that reference system objects. Selecting this option sets the ObjectID filter to greater than or equal to 100, thus eliminating most of the system objects from the trace, and possibly reducing the number of events captured by up to 25 percent.
As a security mechanism, SQL Profiler automatically omits from the trace any of the security-related stored procedures affecting passwords, and this behavior is always in effect and nonconfigurable. This includes procedures such as sp_addapprole, sp_password, sp_addlogin, and sp_addlinkedsrvlogin, as well as many of the procedures for configuring replication.
You can save and restart traces that you define using SQL Profiler. You can also copy the definition to another machine and start it from the SQL Profiler user interface there.
Information gathered by SQL Profiler or SQL Trace can be extremely useful for tracking all kinds of performance problems. By saving the captured events to a table, you can analyze usage patterns and query behavior using Transact-SQL stored procedures. By saving your captured events to a file, you can copy that file to another machine or e-mail it to a central location (or even to your support provider).
Defining a Server-Side Trace
If you want to start a particular trace programmatically (or automatically), you must define a server-side trace using the sp_trace_* internal stored procedures. You can include the calls to these procedures in any SQL Server stored procedure or batch. To define a server-side trace, client programs such as SQL Query Analyzer have to know only four procedures.
- sp_trace_create sets up the trace and configures a file to keep the captured events. It returns a trace ID number that is then used in the other three procedures to further define and manipulate the trace.
- sp_trace_setevent is then called once for each data column of every event that you want to capture.
- sp_trace_setfilter can be called once for each filter you want to define on any of the events' data columns.
- sp_trace_setstatus is called to start, stop or remove the trace.
A fifth procedure, sp_trace_generateevent, can optionally be called to generate user-defined events.
The trickiest part of setting up a server-side trace is that you must use ID numbers when specifying the events and data columns. Fortunately, the page in the SQL Server Books Online that documents the sp_trace_setevent procedure provides the ID number for each event and each data column. Here's an example that creates a trace that writes events to a file called C:\TraceSELECT.trc. It will capture the start time, text, and database ID of each SQL:BatchCompleted event, but the filter restricts the trace to only capturing events that have the substring 'SELECT' in the text data column.
DECLARE @RC int, @TraceID int, @ON bit SET @ON = 1 EXEC @RC = sp_trace_create @TraceID OUTPUT, 0, N'C:\TraceSELECT.trc' SELECT 'RC'= @RC, 'TraceID'= @TraceID -- SQL:BatchCompleted Event, Start Time column EXEC @RC = sp_trace_setevent @TraceID, 12, 14, @ON -- SQL:BatchCompleted Event, Database ID Column EXEC @RC = sp_trace_setevent @TraceID, 12, 3, @ON -- SQL:BatchCompleted Event, Text Column EXEC @RC = sp_trace_setevent @TraceID, 12, 1, @ON -- Audit Login event, Start Column EXEC @RC = sp_trace_setevent @TraceID, 14, 14, @ON -- Set filter for Column 1 (text), data = 'select' EXEC @RC = sp_trace_setfilter @TraceID, 1, 0, 0, N'select' -- Start Trace (status 1 = start) EXEC @RC = sp_trace_setstatus @TraceID, 1
One crucial aspect of these stored procedures is that their parameters must be passed with the correct datatype. The filename parameter for sp_trace_create is of type nvarchar, so a Unicode constant with the N prefix must be supplied for the filename. The last parameter of the sp_trace_setevent procedure, which sets the tracing of that data for that event to either ON or OFF, must be of type bit. Because I can't do a CAST or CONVERT in the procedure call to force a constant of 1 to be a bit, I defined a bit variable to hold the value, and I pass that variable to every call. To modify this trace at a later time, I would need to pass a bit value of 0 to disable the capturing of a particular data column.
Let's look at the procedure that creates the trace in a bit more detail. Here's the syntax:
sp_trace_create [ @traceid = ] trace_id OUTPUT , [ @options = ] option_value , [ @tracefile = ] 'trace_file' [ , [ @maxfilesize = ] max_file_size ] [ , [ @stoptime = ] 'stop_time' ]
The @traceid parameter returns an integer ID that is used to modify a trace, stop or restart it, or look at its properties. The preceding script printed out the value of the trace ID just for informational purposes. The @options parameter allows us to specify one or more options for this trace. Here are the possible values:
0 No options set. 1 Trace should produce a rowset. 2 Start a new trace file when the current file reaches its maximum size. If no maximum size has been specified, the default is 5 MB. This is equivalent to using the Enable File Rollover option in the General tab of the Trace Properties dialog box. 4 SQL Server should shut down if the file cannot be written to. This is needed for servers that are being audited. 8 Produce a Blackbox.trc file, which is a record of the last 5 MB of trace information gathered by the server; cannot be used with any other options.
A value of 1 means that the trace will produce a rowset that will be sent to the SQL Profiler UI, and cannot be used if we are capturing to a server-side file.
You might find it useful to have certain traces running constantly, but be careful about the amount of information you capture. Trace files can grow quite large if they are left running the entire time SQL Server is running. To configure a trace to start automatically every time SQL Server starts, you can put the trace definition into a stored procedure, and then use sp_procoption to set that procedure's startup property to ON.
SQL Server 2000 provides several functions to inspect the status of your traces. The most useful is probably fn_trace_getinfo, which reports all the parameters specified in the sp_trace_create procedure, as well as the status of the trace (1 = currently running). Here's an example of its use:
SELECT * FROM :: fn_trace_getinfo(default)
We could supply a particular trace ID instead of the word "default," but if we don't know the trace ID, using this form shows all the traces. Here's my output:
traceid property value ----------- ----------- ------------------- 1 1 0 1 2 C:\TraceSELECT.trc 1 3 5 1 4 NULL 1 5 1
The row with property 1 contains the value of the @options parameter, as shown in the preceding chart. If you see a trace with a value of 1 for property 1, it is most likely a trace that was started from the SQL Profiler UI. The row with property 2 contains the trace filename, if any. Note that SQL Server will automatically append the trc suffix to your filename, even if you already supplied that suffix. The row with property 3 contains the maximum file size, which defaults to 5 MB, and the row with property 4 contains the stop time, which has no value for my trace. Finally, the row with property 5 is the trace status; a 0 means the trace is stopped, a 1 means the trace is running.
The fn_trace_geteventinfo function will show you what events and data columns you are capturing for a particular trace. The data is returned with the event and data column IDs, so you'll have to do a little work to translate. The function fn_trace_getfilterinfo will return information about the filters on a particular trace.
You might have noticed that there is nothing in the supplied procedures to allow capturing trace data to a table for traces that you define on the server. This is by design, because writing to a table cannot be done as quickly as writing to a file, and it is imperative that the trace capturing operations not lose any events, no matter how busy your server is. If you want to view your trace data in a table, so that you can analyze it using SQL queries, you can copy the data from a trace file to a table using the function fn_trace_gettable.
Server-side traces are wonderfully useful in all kinds of situations and much more efficient that client side tracing with SQL Profiler. If you are avoiding them because you think it's too hard to write all the procedure calls and look up all the necessary event and data column ID information, take heart. You can use the SQL Profiler UI to define all the events, all the data columns and all the filters that you want, and then use the item in the File menu called Script Trace, which will produce all the calls to the stored procedures that correspond to the trace elements you select. The only change you'll need to make is to provide a filename to hold the captured data, and then you can run the newly created script through SQL Query Analyzer to start your trace running as a server-side trace.
Gathering Diagnostic Information
A lot of the information that your traces gather can help your support provider troubleshoot system problems. However, this information is usually not enough by itself. Support providers ask a standard set of questions when you call. A special utility in SQL Server 2000 helps you gather this information with a single command: sqldiag. It can work with a SQL Server trace if you have enabled automatic query recording using the blackbox functionality. I'll talk about this blackbox later in this section. When you execute sqldiag from a command prompt while SQL Server is running, it gathers the following information:
- Text of all error logs (unless the -X, upper case, option has been supplied)
- Registry information
- DLL version information
- Output from:
- sp_configure
- sp_who
- sp_lock
- sp_helpdb
- xp_msver
- sp_helpextendedproc
- sysprocesses
- Input buffer SPIDs/deadlock information
- Microsoft Diagnostics Report for the server, including:
- Contents of <servername>.txt file
- Operating System Version Report
- System Report
- Processor List
- Video Display Report
- Hard Drive Report
- Memory Report
- Services Report
- Drivers Report
- IRQ and Port Report
- DMA and Memory Report
- Environment Report
- Network Report
The information is stored in a file with the default name of sqldiag.txt; you can specify a different filename in the command line for sqldiag. The default directory is the \LOG directory of your SQL Server installation. Obviously, if SQL Server is not running, some of the information in the preceding list won't be available, but any blackbox information will be captured.
To enable blackbox recording, create and start a trace with an option value of 8; when executing the sp_trace_create procedure, don't specify a filename or any other parameters. A trace file called blackbox.trc will automatically be captured in the default \Data directory of your SQL Server installation. If you look at your trace properties with fn_trace_getinfo you can see the exact name of the file. The following example shows the creation of the blackbox trace, and the trace info returned by the fn_trace_getinfo function:
DECLARE @rc int, @TraceID int EXEC @rc = sp_trace_create @TraceID output, 8 SELECT TraceID = @traceID, error = @rc EXEC sp_trace_setstatus @traceID, 1 SELECT * from ::fn_trace_getinfo(@TraceID) RESULTS: TraceID error ----------- ----------- 1 0 (1 row(s) affected) traceid property value ----------- ----------- -------------------------------------- 1 1 8 1 2 C:\Program Files\Microsoft SQL Server \MSSQL\data\blackbox 1 3 5 1 4 NULL 1 5 1 (5 row(s) affected)
If blackbox recording has been enabled, running sqldiag will copy the blackbox.trc file to sqldiag.trc in the same directory as the sqldiag.txt file. If you specify a name other than sqldiag for the text file, the blackbox file will also be copied to the \LOG directory with a different name. For example, if you specify a sqldiag output filename as MyReport.txt, the blackbox trace file will be renamed to MyReport.trc. I mentioned earlier that even if SQL Server is not running when sqldiag is executed, the blackbox file will still be available. This can be very useful if SQL Server came down because of an error; the blackbox trace file will contain a record of what queries were executed immediately before the failure. You might consider creating a stored procedure to enable blackbox tracing, and mark that procedure for autostart. In this case, you'll know that you'll always have a record of the queries that were executed, any time an unexpected failure occurs. On the companion CD, I have included a script to create such a procedure and mark the procedure for autostart.
When you first enable blackbox tracing, you should see the blackbox.trc file in the \Data directory, but you might notice that the size of file looks like it is staying at 0. In fact, you might not actually see a positive size reported for the blackbox.trc file until one of the following occurs:
- The size of the trace exceeds 5 MB.
The blackbox trace is automatically configured for a maximum file size of 5 MB and also configured to rollover and start a new file called blackbox_1.trc when the initial 5 MB is exceeded. If this second trace exceeds 5 MB in size, the trace reverts to the initial blackbox.trc file. Until the first rollover occurs, the operating system file might show a size of 0, even though trace information is being collected.
- You execute sqldiag.
When you run sqldiag, and the trace has more than 128 KB of data, the blackbox trace information will be written to the blackbox.trc file on disk in the \Data directory and copied to the \LOG directory as sqldiag.trc. Note that while the trace is running, information is written to the blackbox.trc file in 128 KB chunks, so that the trace file might not contain the most recent events. If you need the blackbox.trc file or the sqldiag.trc file to have all the events up to a specific time, you must use one of the following two options.
- The blackbox trace is stopped and removed.
When the blackbox trace is closed, SQL Server writes the contents to the blackbox.trc file. If you subsequently run sqldiag, the complete blackbox.trc file is copied to the \Data directory as sqldiag.trc. If you know the trace ID number, you can use the sp_trace_setstatus procedure to both stop and remove the trace, as shown in these examples:
EXEC sp_trace_setstatus <TraceID>, 0 -- Stop the trace EXEC sp_trace_setstatus <TraceID>, 2 -- Remove the trace
- You stop SQL Server.
Shutting down SQL Server effectively stops and closes the trace. This means that if SQL Server stops because of an error condition, and you have previously enabled blackbox tracing, you will have a record of the events just before SQL Server stopped.
- The blackbox trace is stopped and removed.
To enable blackbox tracing to start automatically when SQL Server starts, you must create the trace in stored procedure. Other traces can also be defined inside stored procedures, even if you don't mark them for autostart. You might consider creating a number of procedures that capture events relevant to different performance conditions. For example, one trace might capture events related to stored procedure recompilation; another trace might capture information relating to automatic growth of a database and another might capture deadlock information. You could then set up an alert to watch related Performance Counters using SQL Agent, and when a certain situation is encountered or a threshold is crossed, you could start a trace to gather more data. You'll probably want to limit the size of the trace file and not allow it to roll over and start a new file.
Tracing and Auditing
C2 auditing is necessary if you are running a C2 certified system. A C2 certified system meets a strict government standard that defines the database security level. To have a C2 certified SQL Server, you must configure SQL Server in the evaluated C2 configuration. You must enable c2 audit mode as a server-wide configuration option, and this will automatically start tracing a large number of events specifically designed for auditing purposes. If you look at the list of possible events, you'll see several dozen of them are in the Security Audit category. For more information about C2 certification, see the C2 Administrator's and User's Security Guide, which you can find at http://www.microsoft.com/downloads/release.asp?ReleaseID=24481.
Performance Considerations
SQL Server tracing uses a "pay as you go" model. No overhead is incurred for events that are not captured. Most events need very few resources. SQL Profiler becomes expensive only if you trace all of the more than 100 event classes and capture all data from those events. Early testing shows an absolute maximum of 5 to 10 percent overhead if you capture everything. Most of the performance hit is due to a longer code path; the actual resources needed to capture the event data are not particularly CPU intensive. In addition, to minimize the performance hit, you should define all your traces as server-side traces, and avoid the overhead of producing row sets to send to the SQL Profiler client.
System Monitor
You can use SQL Profiler to monitor the behavior of your server on a query-by-query or event-by-event basis. But if you want to monitor your server's performance as an entire system, the best tool is System Monitor. This tool is extensible, which allows SQL Server to export its performance statistics so that you can monitor your entire system. That's crucial because such important statistics as CPU use must be monitored for the entire system, not just for SQL Server. In fact, many of the most important counters to watch while performance tuning SQL Server don't even belong to any of the SQL Server objects.
System Monitor comes with your Windows 2000 operating system. In Windows NT, the equivalent tool was called Performance Monitor. The discussion here will be relevant no matter which version you are using. Traditionally, in mainframe and minicomputer systems, you had to buy a separate system monitor—at considerable expense—or use a hodgepodge of utilities, some to monitor the operating system and others to monitor the database. Then, if you worked on some other system, it didn't have the same set of tools you were accustomed to using.
In the Programs/Administrative Tools folder, click on the Performance icon to start System Monitor.
System Monitor provides a huge set of counters. Probably no one understands all of them, so don't be intimidated. Peruse all the objects and counters and note which ones have separate instances. Don't confuse System Monitor's use of the word "instance" with a SQL Server 2000 instance. System Monitor uses instance to refer to a particular occurrence of a counter. For example, the SQLServer:Databases object has counters for things like number of active transactions, log file size, and transactions per second. But since there are lots of different databases in a SQL Server instance (such as master, Northwind, and pubs), you also need to choose a particular database from the instance list. Other counters, such as SQLServer:Memory Manager apply to the entire SQL Server installation, and there are no separate instances to deal with. If you want to monitor separate SQL Server instances, there are separate counters to use. For example, the SQLServer:Memory Manager object, which I just mentioned, pertains only to the default instance of SQL Server on the machine. If I also have a named instance called ENT2, there will be an entire set of objects and counters for that instance, including an object called MSSQL$ENT2:Memory Manager. For more information about performance counters, click the Explain button in the Select Counters dialog box, or see the SQL Server and operating system documentation.
SEE ALSO
For general information about using System Monitor, look at the Windows 2000 Server Operations Guide in the Windows 2000 Server Resource Kit, particularly chapters 5 through 10. If you're running Performance Monitor on NT 4, you can look at the Windows NT Workstation Resource Kit Version 4.0 (Chapters 9 through 16). (Prior to Windows NT 4, the Performance Monitoring section of the resource kit was contained in a separate volume called Optimizing Windows NT by Russ Blake, and this has lots of information that is still very useful.)
Performance Monitor Counters
In this section, we'll look at several important counters. I'll briefly explain how they can be useful and what actions you should consider based on the information they provide. Often, of course, the appropriate action is generic: for example, if CPU usage is high, you should try to reduce it. The methods you can use to make such adjustments are varied and vast—from redesigning your application to reworking some queries, adding indexes, or getting faster or additional processors.
Object: Processor
Counter: % Processor Time
This counter monitors systemwide CPU usage. If you use multiple processors, you can set up an instance for each processor. Each processor's CPU usage count should be similar. If not, you should examine other processes on the system that have only one thread and are executing on a given CPU. Ideally, your system shouldn't consistently run with CPU usage of 80 percent or more, although short spikes of up to 100 percent are normal, even for systems with plenty of spare CPU capacity. If your system runs consistently above 80 percent or will grow to that level soon, or if it frequently spikes above 90 percent and stays there for 10 seconds or longer, you should try to reduce CPU usage.
First, consider making your application more efficient. High CPU usage counts can result from just one or two problematic queries. The queries might get high cache-hit ratios but still require a large amount of logical I/O. Try to rework those queries or add indexes. If the CPU usage count continues to be high, you might consider getting a faster processor or adding processors to your system. If your system is running consistently with 100 percent CPU usage, look at specific processes to see which are consuming the CPUs. It's likely that the offending process is doing some polling or is stuck in a tight loop; if so, the application needs some work, such as adding a sleep.
You should also watch for excessively low CPU usage, which indicates that your system is stalled somewhere. If locking contention is occurring, your system might be running at close to 0 percent CPU usage when no productive work is happening! Very low CPU usage can be a bigger problem than very high CPU usage. If you have poor overall throughput and low CPU usage, your application has a bottleneck somewhere and you must find and clear it.
Note that Task Manager (Ctrl-Shift-Escape) in Windows NT 4 and Windows 2000 also provides a way to monitor CPU usage. Task Manager is even easier to use than System Monitor.
Object: PhysicalDisk
Counter: Disk Transfers/sec
This counter shows physical I/O rates for all activity on the machine. You can set up an instance for each physical disk in the system or watch it for the total of all disks. SQL Server does most I/O in 8 KB chunks, although read-ahead I/O is essentially done with an I/O size of 64 KB. Watch this counter to be sure that you're not maxing out the I/O capacity of your system or of a particular disk. The I/O capacity of disk drives and controllers varies considerably depending on the hardware. But today's typical SCSI hard drive can do 80 to 90 random 8 KB reads per second, assuming that the controller can drive it that hard. If you see I/O rates approaching these rates per drive, you should verify that your specific hardware can sustain more. If not, add more disks and controllers, add memory, or rework the database to try to get a higher cache-hit ratio and require less physical I/O (via better design, better indexes, possible denormalization, and so on).
To see any of the counters from the PhysicalDisk object, you must reboot your computer with the Diskperf service started. You do this from a command prompt, with the command DISKPERF. Using the -Y option sets the system to start all the disk performance counters when the system is restarted. After you're done monitoring, disable Diskperf.
Object: PhysicalDisk
Counter: Current Disk Queue Length
This counter indicates the number of reads that are currently outstanding for a disk. Occasional spikes are OK, especially when an operation that generates a lot of asynchronous I/O, such as a checkpoint, is activated. But for the most part, the disks should not have a lot of queued I/O. Those operations, of course, must ultimately complete, so if more than one operation is queued consistently, the disk is probably overworked. You should either decrease physical I/O or add more I/O capacity.
Object: Memory
Counter: Pages/sec and Page Faults/sec
These counters watch the amount of paging on the system. As the system settles into a steady state, you want these values to be 0—that is, no paging going on in the system. In fact, if you allow SQL Server to automatically adjust its memory usage, it will reduce its memory resources when paging occurs. You should find that any paging that does occur is not due to SQL Server. If your system does experience regular paging, perhaps due to other applications running on the machine, you should consider adding more physical memory.
Object: Process
Counter: % Processor Time
Typically, you run this counter for the SQL Server process instance, but you might want to run it for other processes. It confirms that SQL Server (or some other process) is using a reasonable amount of CPU time. (It doesn't make much sense to spend a lot of time reducing SQL Server's CPU usage if some other process on the machine is using the larger percentage of the CPU to drive the total CPU usage near capacity.)
Object: Process
Counter: Virtual Bytes
You use this counter to see the total virtual memory being used by SQL Server, especially when a large number of threads and memory are being consumed. If this number gets too high, you might see Out Of Virtual Memory errors.
Object: Process
Counter: Private Bytes
This counter shows the current number of bytes allocated to a process that cannot be shared with other processes. It is probably the best System Monitor counter for viewing the approximate amount of memory committed by any threads within the sqlservr.exe process space. Additional SQL Server 2000 instances will be labeled sqlservr#1, sqlservr#2, and so on.
Object: Process
Counter: Working Set
This counter shows the amount of memory recently used by a process. For a SQL Server process instance, this counter can actually be a valuable indicator of how much memory has been allocated within the SQL Server process space, especially for a dedicated server (because working-set trimming will likely not happen much). The value recorded by the working set should be very close to the value reported in Task Manager, on the Processes tab, as the Mem Usage value for the instance of sqlservr.exe. Working Set is the current memory that SQL Server (and any components loaded in it) is currently accessing. It might not reflect the total amount of memory that SQL Server (and any component loaded in its process space) has allocated. Here, we use the term "allocated" to mean memory that has been committed to SQL Server. As long as no trimming has occurred, Working Set is the best counter for seeing how much memory has been allocated within the SQL Server process space.
Process: Private Bytes (described above) does not show all the memory committed, but the value can be more stable than Working Set if trimming occurs. You should consider monitoring both Private Bytes and Working Set. If you see Working Set dip below Private Bytes, you should look at Private Bytes. If Working Set dips below Private Bytes, the operating system must be trimming SQL Server's Working Set. This means other processes are competing for memory that SQL Server might need to get back, and you should evaluate what other processes are competing with SQL Server for memory resources.
Object: SQLServer:Buffer Manager
Counter: Buffer Cache Hit Ratio
There is no right value for the buffer cache-hit ratio because it is application specific. If your system has settled into a steady state, ideally you want to achieve rates of 90 percent or higher, but this is not always possible if the I/O is random. Keep adding more physical memory as long as this value continues to rise or until you run out of money.
Object: SQLServer:Memory Manager
Counter: Total Server Memory (KB)
This counter can be useful, but it doesn't reflect all memory allocated within a SQL Server process space. It reflects only memory allocated in the SQL Server buffer pool. Note that the buffer pool is not just for data pages; it is also for other memory allocations within the server, including plans for stored procedures and for ad hoc queries. Certain components can be loaded into the SQL Server process space and allocate memory that is not under SQL Server's direct control. These include extended stored procedures, OLE Automation objects, and OLE DB provider DLLs. The memory space needed for these types of objects is included in SQL Server's Working Set but not in the Total Server Memory counter.
Object: SQLServer:Cache Manager
This object contains counters for monitoring how the cache is being used for various types of objects, including ad hoc query plans, procedure plans, trigger plans, and prepared SQL plans. A separate Cache Hit Ratio counter is available for each type of plan, as is a counter showing the number of such objects and the number of pages used by the objects.
Object: SQLServer:Buffer Manager
Counter: Page Reads/sec
Watch this counter in combination with the counters from the PhysicalDisk object. If you see rates approaching the capacity of your hardware's I/O rates (use 80 to 90 I/Os per disk per second as a guide), you should reduce I/O rates by making your application more efficient (via better design, better indexes, denormalization, and so on). Or you can increase the hardware's I/O capacity. This statistic measures only read operations, not writes, and it does so only for SQL Server, so you don't see the whole picture.
Object: SQLServer:Buffer Manager
Counter: Page Writes/sec
This value keeps track of all physical writes done by SQL Server, for any reason. It includes checkpoint writes, lazywriter writes, and large block writes done during index creation or bulk copy operations. Separate counters are available for checkpoint writes and lazywriter writes; you're probably better off using these more specific counters.
Object: SQLServer:Databases
Counter: Log Flushes/sec
This value should be well below the capacity of the disk on which the transaction log resides. It is best to place the transaction log on a separate physical disk drive (or on a mirrored drive) so that the disk drive is always in place for the next write, since transaction log writes are sequential. There is a separate counter for each database, so make sure you're monitoring the right database instance.
Object: SQLServer:Databases
Counter: Transactions/sec
This counter measures actual transactions—either user-defined transactions surrounded by BEGIN TRAN and COMMIT TRAN or individual data modification statements if no BEGIN TRAN has been issued. For example, if you have a batch that contains two individual INSERT statements, this counter records two transactions. The counter has a separate instance for each database and there is no way to keep track of total transactions for all of SQL Server. Use it only as a general indication of your system's throughput. There is obviously no "correct" value—just the higher the better.
User-Defined Counters
SQL Server 2000 offers 10 performance monitor counters for keeping track of any data or information that is useful to you. These counters are under the SQL Server:User Settable object. The only counter is called Query, and there are 10 instances to choose from. Ten stored procedures are available for specifying a value that System Monitor will chart for a particular instance. For example, if you want to use User Counter 1 to keep track of how many rows are in the invoices table, you can create triggers on the invoices table so that every time a row is inserted or deleted, the stored procedure sp_user_counter1 is executed. You can include the following code in the triggers:
DECLARE @numrows int SELECT @numrows = COUNT(*) FROM invoices EXEC sp_user_counter1 @numrows
Once it is assigned a value, the user counter maintains that value until a new value is assigned. Note that the value passed to the stored procedure must be a constant, a variable, or a parameterless system function starting with @@, and its datatype must be Integer.
Other Performance Monitor Counters
The counters mentioned in this chapter are just the tip of the iceberg. SQL Server has dozens of others, for monitoring almost every aspect of SQL Server behavior discussed in this book. The best way to learn about them is to experiment with System Monitor. Look through the list of available objects and counters, select a few for viewing, and see what results you get. You'll probably find a few that you'll want to use all the time, and others that you'll be interested in only occasionally. But do revisit the complete list because there are too many to remember. A month from now, you'll rediscover a counter that you completely overlooked the first time. You should also revisit the available objects and counters after every service pack upgrade because new ones might be added as the SQL Server development team gets feedback.
Tables 17-1 through 17-5 show some of the counters you might want to experiment with; the descriptions are adapted from the online documentation.
Table 17-1. Counters for the SQLServer:Access Methods object.
| Counter | Description |
|---|---|
| Extents Allocated/sec | Number of extents allocated per second to database objects used for storing index or data records. |
| Forwarded Records/sec | Number of records per second fetched through forwarded record pointers. |
| Full Scans/sec | Number of unrestricted full scans per second. These can be either base-table or full-index scans. |
| Index Searches/sec | Number of index searches per second. These are used to start range scans and single-index record fetches and to reposition an index. |
| Page Splits/sec | Number of page splits per second that occur as the result of overflowing index pages. |
| Pages Allocated/sec | Number of pages allocated per second to database objects used for storing index or data records. |
| Probe Scans/sec | Number of probe scans per second. These are used to find rows in an index or base table directly. |
| Range Scans/sec | Number of qualified range scans through indexes per second. |
| Skipped Ghosted Records/sec | Number of ghosted records per second skipped during scans. |
| Table Lock Escalations/sec | Number of times locks on a table were escalated. |
| Worktables Created/sec | Number of worktables created per second. |
Table 17-2. Counters for the SQLServer:Databases object.
| Counter* | Description |
|---|---|
| Active Transactions | Number of active transactions for the database. |
| Bulk Copy Rows/sec | Number of rows bulk copied per second. |
| Bulk Copy Throughput/sec | Amount (in kilobytes) of data bulk copied per second. |
| Data File(s) Size (KB) | Cumulative size (in kilobytes) of all the data files in the database, including any automatic growth. This counter is useful for determining the correct size of tempdb, for example. |
| Log Cache Hit Ratio | Percentage of log cache reads satisfied from the log cache. |
| Log File(s) Size (KB) | Cumulative size (in kilobytes) of all the transaction log files in the database. |
| Log Growths | Total number of times the transaction log for the database has been expanded. |
| Log Shrinks | Total number of times the transaction log for the database has been shrunk. |
| Log Truncations | Total number of times the transaction log for the database has been truncated. |
| Percent Log Used | Percentage of space in the log that is in use. |
| Shrink Data Movement Bytes/sec | Amount of data being moved per second by autoshrink operations or by DBCC SHRINKDATABASE or DBCC SHRINKFILE statements. |
| Transactions/sec | Number of transactions started for the database per second. |
* Separate instances of these counters exist for each database.
Table 17-3. Counters for the SQLServer:Locks object.
| Counter | Description |
|---|---|
| Average Wait Time (ms) | Average amount of wait time (in milliseconds) for each lock request that resulted in a wait. |
| Lock Requests/sec | Number of new locks and lock conversions per second requested from the lock manager. |
| Lock Timeouts/sec | Number of lock requests per second that timed out, including internal requests for NOWAIT locks. |
| Lock Wait Time (ms) | Total wait time (in milliseconds) for locks in the last second. |
| Lock Waits/sec | Number of lock requests per second that could not be satisfied immediately and required the caller to wait. |
| Number of Deadlocks/sec | Number of lock requests per second that resulted in a deadlock. |
Table 17-4. Counters for the SQLServer:Memory Manager object.
| Counter | Description |
|---|---|
| Connection Memory (KB) | Total amount of dynamic memory the server is using for maintaining connections. |
| Lock Memory (KB) | Total amount of dynamic memory the server is using for locks. |
| Maximum Workspace Memory (KB) | Maximum amount of memory available for executing processes such as hash, sort, bulk copy, and index creation operations. |
| Memory Grants Outstanding | Total number of processes per second that have successfully acquired a workspace memory grant. |
| Memory Grants Pending | Total number of processes per second waiting for a workspace memory grant. |
| Optimizer Memory (KB) | Total amount of dynamic memory the server is using for query optimization. |
| SQL Cache Memory (KB) | Total amount of dynamic memory the server is using for the dynamic SQL cache. |
| Target Server Memory (KB) | Total amount of dynamic memory the server is willing to consume. |
| Total Server Memory (KB) | Total amount (in kilobytes) of dynamic memory that the server is currently using. |
Table 17-5. Counters for the SQLServer:SQL Statistics object.
| Counter | Description |
|---|---|
| Auto-Param Attempts/sec | Number of autoparameterization attempts per second. Total should be the sum of the failed, safe, and unsafe autoparameterizations. Autoparameterization occurs when SQL Server attempts to reuse a cached plan for a previously executed query that is similar to, but not exactly the same as, the current query. |
| Batch Requests/sec | Number of Transact-SQL command batches received per second. |
| Failed Auto-Params/sec | Number of failed autoparameterization attempts per second. This should be small. |
| Safe Auto-Params/sec | Number of safe autoparameterization attempts per second. |
| SQL Compilations/sec | Number of SQL compilations per second. Indicates the number of times the compile code path is entered. Includes compiles due to recompiles. Once SQL Server user activity is stable, this value should reach a steady state. |
| Unsafe Auto-Params/sec | Number of unsafe autoparameterization attempts per second. The table has characteristics that prevent the cached plan from being shared. These are designated as unsafe. The fewer of these that occur the better. |
Other Performance Monitoring Considerations
Any time you monitor performance, you also slightly alter performance simply because of the overhead cost of monitoring. It can be helpful to run System Monitor on a separate machine from SQL Server to reduce that overhead. The SQL Server-specific counters are obtained by querying SQL Server, so they use connections to SQL Server. (System Monitor always uses Windows Authentication to connect to the SQL Server.) It is best to monitor only the counters you are interested in.
EAN: 2147483647
Pages: 179