SQL Server Configuration Settings
Configuration changes can degrade system performance just as easily as they can improve it. This is particularly true in version 2000 of SQL Server, for which most performance-oriented configuration settings are fully automatic. SQL Server 2000 has only 10 configuration options that are not considered "advanced," and none of these directly affects performance. To see all the configuration options, you must change the value of the Show Advanced Options setting:
EXEC sp_configure 'show advanced options', 1 GO RECONFIGURE GO
You should change configuration options only when you have a clear reason for doing so, and you should closely monitor the effects of each change to determine whether the change improved or degraded performance. Always make and monitor changes one at a time.
Serverwide Options
The serverwide options discussed here are set via the sp_configure system stored procedure. Many of them can also be set from SQL Server Enterprise Manager, but there is no single dialog box from which all configuration settings can be seen or changed. Most of the options that can be changed from SQL Server Enterprise Manager user interface are controlled from one of the Properties tabs that you reach by right-clicking on your server. If you use the sp_configure stored procedure, no changes take effect until the RECONFIGURE command (or RECONFIGURE WITH OVERRIDE, in some cases) is issued. Some changes (dynamic changes) take effect immediately upon reconfiguration, but others do not take effect until the server is restarted. If an option's run_value and config_value as displayed by sp_configure are different, you must restart the server in order for the config_value to take effect.
We won't look at every configuration option here—only those that relate directly to performance. In most cases, we'll discuss options that you should not change. Some of these are resource settings that relate to performance only in that they consume memory (for example, open objects). But if they are configured too high, they can rob a system of memory and degrade performance. I'll group the sp_configure settings by functionality. Keep in mind that SQL Server sets almost all of these options automatically, and your applications will work well without you ever looking at these options.
Memory Options
Before version 7 of SQL Server, you had to manually configure memory options; this is no longer the case. In Chapter 3, you saw how SQL Server uses memory, including how it allocates memory for different uses and when it reads data from or writes data to disk. But we did not discuss how much memory SQL Server actually uses for these purposes or how to monitor the amount of the system's memory resources it uses.
min server memory and max server memory By default, SQL Server automatically adjusts the total amount of the memory resources it will use. However, you can use the min server memory and max server memory configuration options to take manual control. The default setting for min server memory is 0 (MB), and the default setting for max server memory is 2147483647. If you use the sp_configure stored procedure to change both of these options to the same value, you basically take full control and tell SQL Server to use a fixed memory size. This mimics the memory configuration behavior prior to SQL Server 7. You can also use SQL Server Enterprise Manager to set a minimum and maximum value for memory, using the Memory tab of the SQL Server Properties dialog box (shown in Figure 17-2). To bring up the dialog box, right-click on the name of your server and then choose Properties.
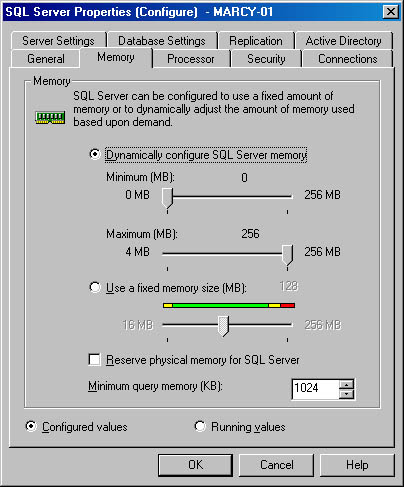
Figure 17-2. The Memory tab of the SQL Server Properties dialog box.
You can set the minimum and maximum memory using slider bars. Note that the maximum allowed is slightly less than the amount of physical memory in the machine. The absolute maximum of 2147483647 MB previously mentioned is actually the largest value that can be stored in the integer field of the sysconfigures table. It is not related to the actual resources of your system. You can select a separate option button to indicate that you want to use a fixed size. Setting the minimum and maximum sliders to the same value has the same effect.
set working set size The Memory tab of the SQL Server Properties dialog box also includes a check box labeled Reserve Physical Memory For SQL Server. Selecting this is equivalent to setting the configuration option set working set size to 1, which reserves physical memory space for SQL Server that is equal to the server memory setting. Do this only if you don't want SQL Server to dynamically adjust its memory usage. Setting set working set size means that the operating system does not swap out SQL Server pages even if they can be used more readily by another process when SQL Server is idle. If the operating system's virtual memory manager must page, it must do so from other processes. These other processes can include other instances of SQL Server. This setting defaults to 0, which allows the Windows NT or Windows 2000 virtual memory manager to determine the working set size of SQL Server.
As I've mentioned, you should generally let SQL Server take full control of the memory values, especially if you have multiple instances running, but if your server might be inactive for long periods, you can manually set min server memory so that when someone finally submits a query, memory will be available and the query can be processed quickly. If you have other critical applications on your server that might have inactive periods, you can manually set max server memory so that SQL Server will not use too much system memory and so that when the other application becomes active again, memory will be available for it to use.
When SQL Server uses memory dynamically, the lazywriter queries the system periodically to determine the amount of free physical memory available. The lazywriter expands or shrinks the buffer cache to keep the operating system's free physical memory at 5 MB plus or minus 200 KB to prevent paging. If less than 5 MB is free, the lazywriter releases memory to the operating system that usually goes on the free list. If more than 5 MB of physical memory is free, the lazywriter recommits memory to the buffer cache. The lazywriter recommits memory to the buffer cache only when it repopulates the free list; a server at rest does not grow its buffer cache.
SQL Server also releases memory to the operating system if it detects that too much paging is taking place. You can tell when SQL Server increases or decreases its total memory use by using SQL Profiler to monitor the Server Memory Change event (in the Server category). An event is generated whenever SQL Server's memory increases or decreases by 1 MB or 5 percent of the maximum server memory, whichever is greater. You can look at the value of the data element called Event Sub Class to see whether the change was an increase or a decrease. An Event Sub Class value of 1 means a memory increase; a value of 2 means a memory decrease. We'll look at SQL Profiler in more detail later in this chapter.
awe enabled A third memory option called awe enabled is available only for SQL Server 2000 Enterprise (or Developer) Edition running under Windows 2000 Advanced Server or DataCenter Server. This option enables the use of the Windows 2000 Address Windowing Extensions (AWE) API to support very large memory sizes. SQL Server 2000 can use as much memory as Windows 2000 Advanced Server or Windows 2000 DataCenter Server allows. Instances of SQL Server 2000 do not dynamically manage the size of the address space when you enable AWE memory. Therefore, when you enable AWE memory and start an instance of SQL Server 2000, one of the following occurs:
- If less than 3 GB of free memory is available on the computer, memory is dynamically allocated and, regardless of the parameter setting for awe enabled, SQL Server will run in non-AWE mode.
- If sp_configure max server memory has been set and at least 3 GB of free memory is available on the computer, the instance acquires the amount of memory specified in max server memory. If the amount of memory available on the computer is less than max server memory (but more than 3 GB) or if max server memory has not been set, the instance acquires almost all of the available memory and can leave up to only 128 MB of memory free.
If you're running multiple instances of SQL Server 2000 on the same computer and each instance uses AWE memory, you must pay close attention to certain configuration issues. The following list is taken from SQL Server 2000 Books Online, which documents that you must ensure the following:
- Each instance has a max server memory setting.
- The sum of the max server memory values for all the instances is less than the amount of physical memory in the computer.
If the sum of the settings exceeds the physical memory on the computer, some of the instances either will not start or will have less memory than is specified in max server memory. For example, suppose a computer has 16 GB of physical RAM and has three instances of SQL Server 2000 running on it. Furthermore, max server memory is set to 8 GB for each instance. If you stop and restart all three instances:
- The first instance will start with the full amount of 8 GB of memory.
- The second instance will start, but with slightly less than 8 GB of memory (up to 128 MB less).
- The third instance will start in dynamic memory mode and will have 128 MB or less memory available to it.
user connections SQL Server 2000 dynamically adjusts the number of simultaneous connections to the server if the user connections configuration setting is left at its default of 0. Even if you set this value to a different number, SQL Server does not actually allocate the full amount of memory needed for each user connection until a user actually connects. When SQL Server starts up, it allocates an array of pointers with as many entries as the configured value for user connections. Each entry uses less than 1000 bytes of memory. Each user who connects to SQL Server is allocated 24 KB for three memory objects of one page (8 KB) each. These memory objects keep track of things such as the Process Status Structure (PSS) for each connection and the context area needed by the User Mode Scheduler (UMS) to keep track of the user's context as it moves the wait queue to a CPU and back again.
You should always let SQL Server dynamically adjust the value of the user connections option. If you configure the value too low, future connections will be denied access to SQL Server. Even if you're trying to limit the number of actual simultaneous users, this can backfire because connections are not the same as users. One user can open multiple connections through the same application. If you're using a query tool such as SQL Query Analyzer, each time you click the New Query button you start a new connection to the server that counts against the total.
locks The locks configuration option sets the number of available locks (of all types). The default is 0, which means that SQL Server adjusts this value dynamically. It starts by allocating 2 percent of the memory allotted to SQL Server to an initial pool of lock structures. When the pool of locks is exhausted, it allocates additional locks. The dynamic lock pool does not allocate more than 40 percent of the memory allocated to SQL Server. If too much memory is being used for locks, SQL Server escalates row locks into table locks wherever possible. You should leave this value at its default. If you manually supply a value for the maximum number of locks, once that number of locks is reached, any query that requests additional lock resources will receive an error message and the batch will terminate.
Scheduling Options
SQL Server 2000 has a special algorithm for scheduling user processes, which uses UMS threads (as described in Chapter 3). There is one UMS thread per processor, and the UMS makes sure that only one process can run on a scheduler at any given time. The UMS manages assignment of user connections to UMS threads to keep the number of users per CPU as balanced as possible. Four configuration options affect the behavior of the scheduler: lightweight pooling, affinity mask, priority boost, and max worker threads.
lightweight pooling By default, SQL Server operates in thread mode, which means that the UMS schedules the operating system threads. However, SQL Server also lets user connections run in fiber mode; fibers are less expensive to manage than threads. The lightweight pooling option has a value of 0 or 1; 1 means that SQL Server should run in fiber mode. Using fibers can yield a minor performance advantage, perhaps as much as a 5 percent increase in throughput when all of the available CPUs are operating at 100 percent. However, the tradeoff is that certain operations, such as running queries on linked servers or executing extended stored procedures, must run in thread mode. The cost of switching from fiber to thread mode for those connections can be noticeable, and in some cases will offset any benefit of operating in fiber mode.
If you're running in an environment with multiple CPUs, all of which are operating at 100 percent capacity, and if System Monitor shows a lot of context switching, setting lightweight pooling to 1 might yield some performance benefit. With a system using more than four processors, the performance improvements should be even greater.
affinity mask You can use the affinity mask setting to bind all the threads (or fibers) handled by one UMS thread to a certain processor. You should avoid doing this because this setting prevents the operating system from using whatever processor is currently most available; each UMS must then schedule its threads on the same processor.
You can also use this setting to limit the number of processors that SQL Server can use. For example, on an eight-processor system, setting affinity mask to 63 decimal or 00111111 binary means that SQL Server can use only processors 0 through 5. Two processors are reserved for other, non_SQL Server activity.
The affinity mask option was added in version 6.5 at the request of some major customers who ran SMP hardware with more than four processors. These sites were accustomed to similar options on UNIX or mainframe systems. Most sites do not need this option.
priority boost If the priority boost setting is enabled, SQL Server runs at a higher scheduling priority. The default is 0, which means that SQL Server runs at normal priority whether you're running it on a single-processor machine or on an SMP machine. Enabling the priority boost option allows the SQL Server process to run at high priority. There are probably very few sites or applications for which setting this option will make much difference, so I recommend leaving it alone. But if your machine is totally dedicated to running SQL Server, you might want to enable this option (set it to 1) to see for yourself. It can potentially offer a performance advantage on a heavily loaded, dedicated system. Contrary to some folklore, this setting does not make SQL Server run at the highest operating system priority.
max worker threads SQL Server uses the operating system's thread services by keeping a pool of worker threads (or fibers) that take requests off the queue. It attempts to evenly divide the worker threads among the UMS schedulers so the number of threads available to each UMS is the setting of max worker threads divided by the number of CPUs. With 100 or fewer users, there are usually as many worker threads as active users (not just connected users who are idle). With more users, it often makes sense to have fewer worker threads than active users. Although some user requests have to wait for a worker thread to become available, total throughput increases because less context switching occurs.
The max worker threads setting is somewhat autoconfigured. The default is 255, which does not mean that 255 worker threads are in the pool. It means that if a connection is waiting to be serviced and no thread is available, a new thread is created if the thread total is currently below 255. If this setting is configured to 255 and the highest number of simultaneously executing commands is, say, 125, the actual number of worker threads will not exceed 125. It might be even less than that because SQL Server destroys and trims away worker threads that are no longer being used. You should probably leave this setting alone if your system is handling 100 or fewer simultaneous connections. In that case, the worker thread pool will not be greater than 100.
Even systems that handle 4000 or more connected users run fine with the default setting of 255. When thousands of users are simultaneously connected, the actual worker thread pool is usually well below 255 because from the back-end database perspective most connections are idle, even though the user might be doing plenty of work on the front end.
Disk I/O Options
No options are available for controlling SQL Server's disk read behavior. All the tuning options to control read-ahead in previous versions of SQL Server are now handled completely internally. One option is available to control disk write behavior. This option controls how frequently the checkpoint process writes to disk.
recovery interval The recovery interval option can be automatically configured. SQL Server setup sets it to 0, which means autoconfiguration. In SQL Server 2000, this means a recovery time of less than one minute, but that might change in later releases or service packs. This option lets the database administrator control the checkpoint frequency by specifying the maximum number of minutes that recovery should take.
Prior to version 7 of SQL Server, the recovery interval was set in terms of minutes; the default was 5. In practice, this meant a checkpoint every 30,000 log records, which was almost always much less than every 5 minutes because the implementation was not scaled for today's faster systems. In SQL Server 2000, recovery is more likely to match the recovery interval option, assuming that the system was busy before it came down. For databases with more than 20 MB of log records, the recovery interval directly corresponds to the checkpoint frequency. Thus, a recovery interval of 5 means that checkpoints occur only every 5 minutes and all dirty pages are written to disk.
Query Processing Options
SQL Server has several options for controlling the resources available for processing queries. As with all the other tuning options, your best bet is to leave these options at their default values unless thorough testing indicates that a change might help.
min memory per query When a query requires additional memory resources, the number of pages it gets is determined partly by the min memory per query option. This option is relevant for sort operations that you specifically request using an ORDER BY clause, and it also applies to internal memory needed by merge join operations and by hash join and hash grouping operations This configuration option allows you to specify a minimum amount of memory (specified in kilobytes) that any of these operations should be granted before they are executed. Sort, merge and hash operations receive memory in a very dynamic fashion, so you rarely need to adjust this value. In fact, on larger machines, your sort and hash queries typically get much more than the min memory per query setting, so you shouldn't restrict yourself unnecessarily. If you need to do a lot of hashing or sorting, however, and you have few users or a lot of available memory, you might improve performance by adjusting this value.On smaller machines, setting this value too high can cause virtual memory to page, which hurts server performance.
query wait The query wait option controls how long a query that needs additional memory waits, if that memory is not available. A setting of -1 means that the query waits 25 times the estimated execution time of the query, but it will always wait at least 25 seconds with this setting. A value of 0 or more specifies the number of seconds that a query will wait. If the wait time is exceeded, SQL Server generates error 8645:
Server: Msg 8645, Level 17, State 1, Line 1 A time out occurred while waiting for memory resources to execute the query. Re-run the query.
Even though memory is allocated dynamically, SQL Server can still run out if the memory resources on the machine are exhausted. If your queries time out with error 8645, you can try increasing the paging file size or even add more physical memory. You can also try tuning the query by creating more useful indexes so that hash or merge operations aren't needed. Keep in mind that this option affects only queries that have to wait for memory needed by hash and merge operations. Queries that have to wait for other reasons will be unaffected.
index create memory The min memory per query option applies only to sorting and hashing used during query execution; it does not apply to the sorting that takes place during index creation. Another option, index create memory, lets you allocate a specific amount of memory for index creation. Its value is also specified in kilobytes.
query governor cost limit You can use the query governor cost limit option to set a maximum length of time that a query will run. SQL Server will not execute queries that the optimizer estimates will take longer than this. The option is specified in seconds, but it might not map exactly to seconds on your machine. You should think of the value as an abstract cost of the query rather than an actual number of seconds. The cost figure was correlated to seconds on one test machine in the SQL Server development group, and no information is available on the exact specs of that machine.
You can come up with your own correlation using SQL Profiler. If you capture the Performance: Execution Plan events, the data element called Binary Data reflects the optimizer's estimated cost for each SQL statement. This value is compared to the query governor cost limit value. If you then also capture the Duration data for each SQL statement, you can compare the estimated cost with the actual duration. For example, if, on average, queries that show a cost (in the SQL Profiler trace) of 8 seconds take 10 seconds to run, you should specify a query governor cost limit of about 80 percent of what you really want to allow. If you want to block all queries that are estimated to take longer than 1 minute to run, you should set the option to 48 (80 percent of 60 seconds). We'll look at SQL Profiler in more detail later in this chapter.
max degree of parallelism and cost threshold for parallelism SQL Server 2000 lets you run certain kinds of complex queries simultaneously on two or more processors. The queries must lend themselves to being executed in sections. Here's an example:
SELECT AVG(charge_amt), category FROM charge GROUP BY category
If the charge table has 100,000 rows and there are 10 different values for category, SQL Server can split the rows into groups and have only a subset of the groups processed on each processor. For example, with a 4-CPU machine, categories 1 through 3 can be averaged on the first processor, categories 4 through 6 on the second processor, categories 7 and 8 on the third, and categories 9 and 10 on the fourth. Each processor can come up with averages for only its groups, and the separate averages are brought together for the final result.
During optimization, the optimizer always finds the cheapest possible serial plan before considering parallelism. If this serial plan costs less than the configured value for the cost threshold for parallelism option, no parallel plan is generated. The cost threshold for parallelism option refers to the cost of the query in seconds, but just like the query governor cost limit option, the value is not in actual clock seconds. The default value for the cost threshold for parallelism option is 5. Otherwise, if the cheapest serial plan costs more than this configured threshold, a parallel plan is produced based on some assumptions about how many processors and how much memory will actually be available at run time. This parallel plan cost is compared with the serial plan cost and the cheaper one is chosen. The other plan is discarded.
When the parallel plan is created, the optimizer inserts exchange operators into the query execution plan to prepare the query for parallel execution. An exchange operator is an operator in a query execution plan that provides process management, data redistribution, and flow control. The two main types of exchange operators that you'll observe if parallel plans are generated are the distribute operator, which separates the processing into multiple streams, and the gather operator, which retrieves the separate results and combines them into a single result. Occasionally, you'll also see a redistribute operator if the original streams need to be moved onto different processors at some point during the processing.
A parallel query execution plan can use more than one thread; a serial execution plan, which is used by a nonparallel query, uses only a single thread. The actual number of threads used by a parallel query is determined at query plan execution initialization and is called the degree of parallelism (DOP). This is the algorithm for determining what DOP to run at, based on the state of the system:
- The maximum DOP of a query is the minimum of the configured max degree of parallelism value, the OPTION query hint MAXDOP, if any was specified, and the number of schedulers in the system:
MaxDOP = min ('max degree of parallelism', 'OPTION MAXDOP', #schedulers) - The maximum DOP is further limited by dividing half the number of free threads available at the time the query starts by the number of concurrent "branches" the query might run. Each branch represents one stage of the query. For example, a branch might be a parallel scan or a parallel hash join. Note, however, that because SQL Server does not reserve these threads in any way, it might still run short of threads at runtime and get an 8642 error. If this happens, you should consider increasing the max worker threads configuration parameter:
MaxDOP = min (MaxDOP, 0.5 * #free threads / #concurrent branches in this statement)
- Next, SQL Server determines whether the query is a "large" query. If so, the query will run at the MaxDOP determined in the previous steps. In SQL Server 2000, a query is considered "large" if the serial cost of the query is greater than 600 (10 minutes). This limit was added to avoid situations in which a long-running query starts running at a low DOP because the system is busy and continues to run at that low DOP even if the system becomes less busy and more resources become available. (See the next step for more details.)
If (optimizer's parallel cost * optimizer's estimated DOP > 600) Then DOP = MaxDOP
- If the query is not a large query, SQL Server looks at how busy the system is to decide its DOP. First, it looks at how many active threads are in the system. A thread is determined to be active if it is being used by some connection, so this does not include internal system tasks. If there are more than four active threads per scheduler, SQL Server is very conservative with DOP and runs with DOP 0, which is in effect a serial plan:
If (#active threads > 4 * #schedulers) Then DOP = 0
- Otherwise, if there are no more than four active threads per scheduler, SQL Server looks at how many schedulers are currently idle (have no worker threads that are running or capable of running at that instant). This value is then used as the DOP:
DOP = #idle schedulers
Once a query starts executing on multiple threads for parallel execution, it uses the same number of threads until completion. Each time a parallel query execution plan is retrieved from the cache, SQL Server reexamines the optimal number of threads specified. One execution of a query can result in the use of a single thread, and another execution of the same query (at a different time) can result in using two or more threads.
As you can see in the calculations above, the max degree of parallelism option indicates the maximum number of processors that are used to run queries in parallel. The default value of 0 means that SQL Server should use the number of available CPUs. A value of 1 means that SQL Server should suppress parallelism completely. Any other value restricts the degree of parallelism below the number of CPUs. If your computer has only one processor, the max degree of parallelism value is ignored.
Be careful when you use the max degree of parallelism or cost threshold for parallelism options—they have serverwide impact. You can also use trace flag 8687 to turn off parallelism for individual connections.
You can use SQL Profiler to trace the degree of parallelism for each query captured. If you choose to monitor events in the Performance category, you'll see four different events for Degree Of Parallelism. This is so you can use the SQL Server 2000 Profiler to trace a SQL Server 7 Server. In that case, a different one of the options is used for each different DML statement (Delete, Insert, Select, or Update). In SQL Server 2000, tracing any of these four events will write a row to the trace output for every query indicating its degree of parallelism. The Event Sub Class data is a number indicating which DML statement was run: 1 = SELECT, 2 = INSERT, 3 = UPDATE, or 4 = DELETE. The value in the Binary Data column indicates the degree of parallelism actually used for that query—that is, the number of CPUs used to perform the operation.
Database Options
Several database options can affect performance. The read only and single user options affect performance because they eliminate locking in some cases. If your database is used only for decision support (for example, a data mart), it might make sense to set your database to read only, as follows:
ALTER DATABASE 'dbname' SET READ_ONLY
In this way, no locking is performed in the database; this greatly reduces overhead. This option prevents changes from being made to the database. You can easily toggle it off to perform tasks such as bulk loading of data. For an operation in which the data is changed via large batch jobs that can run during off-hours and the normal workload is query only, read only is a good choice.
Even if your database is not read only, you might want to perform off-hour maintenance tasks and bulk loading operations with the single user option enabled, as shown here:
ALTER DATABASE 'dbname' SET SINGLE_USER
This option also eliminates the need for locking because only one connection can use the database at a time. Of course, you need locking to make a multiuser system behave like a single-user system. But in this case, it is a single-user system, so locking is not required. If you need to do a big bulk load and index creation at night while no one else is using the system, you can eliminate the need to take locks during the bulk load.
Two other options are particularly useful if you're running SQL Server Desktop Edition on a small machine and your resources are extremely limited: autoclose and autoshrink. The autoclose option causes the database to shut down cleanly and free resources after the last user exits. By default, it is set to TRUE for all databases when SQL Server runs on Windows 98. The database reopens automatically when a user tries to use the database. The autoshrink option (discussed in Chapter 5) can be useful if your disk space resources are extremely limited, but there is a performance tradeoff. Shrinking a database is a CPU-intensive operation and takes a long time. All indexes on heaps affected by the shrink must be adjusted because the row locators change.
Finally, two database options control the automatic gathering of statistics: auto create statistics and auto update statistics. These were both discussed in Chapter 15.
Buffer Manager Options
In Chapter 3, we saw how the buffer manager (also known as the cache manager) uses a queue of "favored pages," which you can think of as a least recently used (LRU) algorithm, but no queue list of buffers is maintained in the order of most recent access. You can use the pintable option to directly influence the favoring behavior.
Pinning a Table in the Cache
You can permanently remove a table from the queue of pages examined by the lazywriter so that once they are read into the data cache, they are never forced from cache. (This favors them permanently, although it is really more than that: they are entirely exempted.) You can enable this option using the sp_tableoption stored procedure with the pintable option.
The pintable option is not appropriate for most sites. But if you get very random cache hits and you have some relatively small tables that are hot compared to other larger tables, this option might be beneficial. If those small, hot tables keep getting forced out by the random access to larger tables and you have plenty of memory, you can pin those small tables. By pinning, you override the buffer manager. But you take away the pages in cache used for that table, so you give the buffer manager less memory to work with. Pinning the table does not initially read it in; pinning just makes the table "sticky" so that once a page of the table is in the cache, it doesn't get forced out. If you want the table preloaded and sticky, you can enable the option and then do SELECT * FROM table to read all the pages into cache. Be careful when you use this option; the table shouldn't be so big that you eat up more memory than your system can afford to use.
Monitoring Buffer Manager Performance
Two DBCC commands exist to monitor the performance of the buffer manager; they are known as SQLPERF(WAITSTATS) and SQLPERF(LRUSTATS). DBCC SQLPERF(WAITSTATS) not only provides an overview of the buffer manager, it helps identify where a transaction is delayed. It shows the total milliseconds of wait time and how much of the time is due to waiting for reads, waiting for different types of locks, waiting to add a log record to the log buffer, and waiting for log buffers to be physically written. The command DBCC SQLPERF(LRUSTATS) gives details on the lazywriter and the state of the cache, such as the cache-hit ratio, the size of the cache, the average number of pages scanned to find an available buffer, and the number of free pages. Although this information is available through System Monitor, the DBCC SQLPERF command lets you capture the output to a table and save the data for analysis.
For example, to capture the DBCC SQLPERF(WAITSTATS) output, you can create a table with four columns and use the dynamic EXECUTE command to populate the table. The following script shows one way to define and populate such a table. It actually adds a fifth column to the table, which indicates the current date and time that the rows were inserted into the table.
CREATE TABLE waitstats ( wait_type varchar(20), requests numeric(10, 0), wait_time numeric(12, 2), signal_wait numeric(12, 0), recorded_time datetime DEFAULT GETDATE() ) GO INSERT INTO waitstats (wait_type, requests, wait_time, signal_wait) EXEC ('DBCC SQLPERF(WAITSTATS)') Startup Parameters on SQLSERVR.EXE
You can alter startup parameters used by the SQL Server process to tune performance by disabling the performance statistics collection or specifying trace flags.
Disabling the Performance Collection
Normally, SQL Server keeps performance statistics such as CPU usage and amount of I/O on a per-user basis. The values are materialized in the sysprocesses table when queried. If you never query or monitor these values, the work to keep track of them is unnecessary. You can eliminate the calls that produce these performance statistics by passing the -x startup flag to sqlservr.exe. Or you can add -x as an additional parameter from the Setup program via the Set Server Options dialog box.
Specifying Trace Flags
We've discussed the use of trace flags several times, and you've seen how to enable them using DBCC TRACEON. You can also specify a trace flag at server startup; some trace flags make the most sense if they are specified serverwide rather than on a per-user basis. For example, trace flag 1204, which records information to the error log when a deadlock occurs, doesn't make sense for a specific connection because you probably have no idea ahead of time which connections will encounter deadlocks. To enable a trace flag serverwide, you add the flag as a parameter when you start SQL Server from the command line (for example, sqlservr.exe -c -t1204).
EAN: 2147483647
Pages: 179
- MPLS VPN Architecture and Terminology
- PE-CE Routing Protocol-Static and RIP
- Case Study-Hub and Spoke MPLS VPN Network Using BGP PE-CE Routing for Sites Using Unique AS Numbers
- Case Study 2: Implementing Multi-VRF CE, VRF Selection Using Source IP Address, VRF Selection Using Policy-Based Routing, NAT and HSRP Support in MPLS VPN, and Multicast VPN Support over Multi-VRF CE
- Case Study 6: Implementing Class-Based Tunnel Selection with MPLS Traffic Engineering