Debugging and Logging


Looking at the left navigational bar, the next header we encounter is the Debugging and Logging header. Beneath this header, you find several clickable menu items that control how data sources and other external configurable data components behave.

Debugging Settings

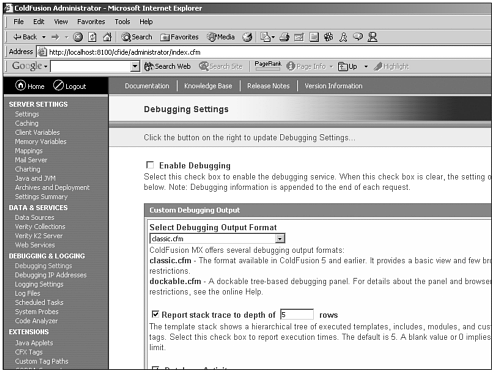
First, let's look at the Debugging Settings page. Figure 25.14 gives you a look at the page inside the Administrator.

Figure 25.14. Debugging Settings page in the ColdFusion Administrator.

graphics/25fig14.gif

In this part of the Administrator, you can control seven, serverwide debugging options. Table 25.7 covers those seven options and what they do.

Table 25.7. Debugging Options Available Through the ColdFusion Administrator

Option

Description of Option

Enable Debugging

The Enable Debugging check box is the key to the debugging engine. Without this box checked, you are unable to retrieve any debugging information. It is good to leave this turned off in production, as there is generally no need to debug code on a production server.

Select Debugging Output Format

In ColdFusion MX, you can now choose from two ways in which to present the debugging information. There is the classic.cfm selection, which present debugging data as you're used to seeing it if you've worked with previous versions of ColdFusion, but there's also now the dockable.cfm selection, which puts all the debugging output into a dockable Dynamic Hypertext Markup Language (DHTML) browser window. This enables you to collapse and expand the debugging information and keep it open in a separate window at all times.

Report stack trace to a depth of x rows

This selection enables you to tell ColdFusion how much information you want returned when a stack trace is generated on your server. Whatever number you enter into this field, that is the number of CFML tag executions the stack trace records backward from the point of the crash.

Database activity

Checking this box displays the structured query language (SQL) or stored procedure information that was used to execute against the database in whatever template you are currently running.

Exception Information

Leaving this option turned on cause ColdFusion to display any exception information in the debugging output should an exception be encountered while running the current template.

Tracing Information

When this is turned on, tracing information shows up in the debugging output. You need to turn this setting on if you want to use the CFTRACE tag to watch logic flow from within your CFML templates.

Variables

When this setting is turned on, all common gateway interface (CGI), form, session, application, and other variables are displayed in the debugging output.

Debugging IP Addresses

This section, again, is fairly self-explanatory. This is where you enter the IP addresses of any machines that you want the debugging information returned to when debugging is enabled. If debugging is enabled and no IP addresses are present, debugging output is returned to all clients. For this reason, it's usually a good idea to leave the loopback IP address (127.0.0.1) entered here. This way, when you want someone else to view the debugging output, you are forced to add them. This might sound like a pain, but it can keep you from unwittingly exposing your debugging information to someone whom you don't want to see it.

Logging Settings

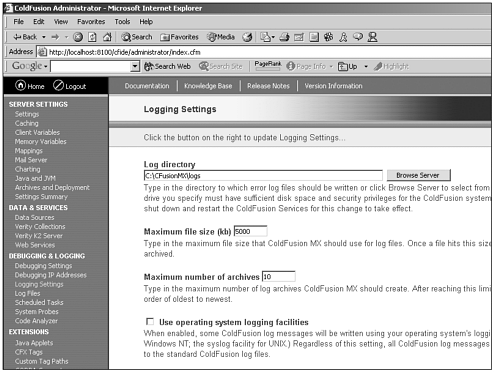
Next, let's look at the Logging Settings page. Figure 25.15 gives you a look at the page inside the Administrator.

Figure 25.15. Logging Settings page in the ColdFusion Administrator.

graphics/25fig15.gif

From this page, you can control seven, serverwide settings that control how logging is handled on this particular ColdFusion Server. Table 25.8 gives you an overview of each setting available.

Table 25.8. Options Available on the Logging Settings Page Within the ColdFusion Administrator

Setting

Description of Setting

Log directory

This setting enables you to specify the directory where you would like all error log files to be written.

Maximum file size (kb)

This setting enables you to control the maximum file size that you want ColdFusion to use for its log files. This setting caps an individual log size at whatever number you enter here. When that file size is reached, the files are deleted in order from oldest to newest.

Maximum number of archives

This setting enables you to control the maximum number of log archives that you want to be created. After reaching this limit, archived log files are deleted in order from oldest to newest.

Use operating system logging facilities

Checking this box sends all logging information to the operating system's internal logging facilities, bypassing the standard ColdFusion logs.

Log slow pages taking longer than x seconds

This setting enables you to specify a maximum time that you want any template to take before an entry is made in the log file telling you that the template is running long.

Log all CORBA calls

Just as it says, this setting log all Common Object Request Broker Architecture (CORBA) calls.

Enable Logging for Scheduled Tasks

This setting logs any task scheduling in your standard logs.

Logging Files

Next, let's look at the Log Files page. From this page, you can manage any log files that have been created by the ColdFusion Server. From this page, you can view, delete, email, or archive any of the existing log files and search specific log files for information.

Scheduled Tasks

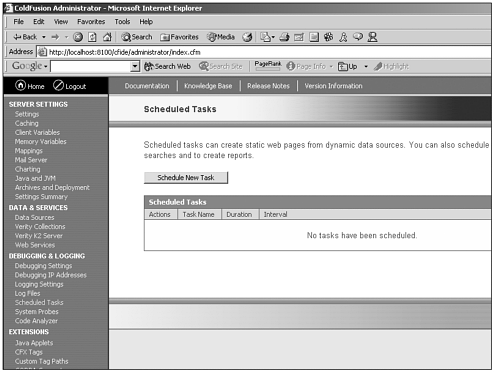
Next, let's look at the Scheduled Tasks page. Figure 25.16 gives you a look at the page inside the Administrator.

Figure 25.16. Scheduled Task page in the ColdFusion Administrator.

graphics/25fig16.gif

From this page you can add/edit/delete scheduled tasks to the ColdFusion Administrator. Creating a scheduled tasks works just as it would if you were to call a CFML template manually on a URL only with scheduled tasks, you can control the specific date and time that these templates are called.

System Probes

Much like scheduled tasks, system probes access a CFML template at a specific time. However, system probes are checking for either the presence or absence of a string at the URL they are calling. These probes enable you to keep a "health-check" on your ColdFusion Server. You are essentially asking the server if it's okay. If the server is okay, it says "yes." Otherwise, notifications are sent as you have specified in the system probes section of the Administrator.

Code Analyzer

The code analyzer enables you to check your existing ColdFusion applications for compatibility with ColdFusion MX. In almost all cases, applications written for previous versions of ColdFusion work fine on ColdFusion MX. In those rare instances where you might encounter problems, the code analyzer has been provided to help you easily highlight those problems before migration so that you can correct them.


Inside ColdFusion MX
Inside Coldfusion MX
ISBN: 0735713049
EAN: 2147483647
Year: 2005
Pages: 579

flylib.com © 2008-2017.
If you may any questions please contact us: flylib@qtcs.net