Section 12.4. A Usability Study of Cryptographic Smart Cards
12.4. A Usability Study of Cryptographic Smart CardsThis section describes the aim, scope, context, user selection, task definition, measurement apparatus, processing, and results of our usability study. 12.4.1. Aim and ScopeThe aim of this usability study was to compare alternative form factors of cryptographic smart cards that is, comparing traditional smart cards with USB tokens. Smart cards are often praised for their usability:[21] they are mobile, can be used in multiple applications, and carry lower administrative costs than systems based on multiple usernames/passwords. On the other hand, smart cards are also criticized for their low market acceptance.[22], [23] Garfinkel states that "few people use this [smart card] added security option because smart cards and readers are not widely deployed."[24] However, alternative form factors to the familiar plastic smart card are emerging, and proponents of these technologies claim that they overcome the limitations of smart cards.[25]
12.4.2. Context and Roles DefinitionThe scenario set up for this study compares three form factors: the traditional plastic smart card with a USB smart card reader, and two types of USB tokens (see Figure 12-1). We label these two types of USB tokens base and advanced; the advanced type is identical to the base one, but has an additional feature, as described shortly. The base type of USB token integrates, in one single object, both the smart card reader and the cryptographic smart card IC. The IC embedded in the tokens used in the usability test is the same one embedded in the smart cards. The advanced USB token adds mass storage to the base type; when connected to the host system, this token will make available as separate resources both the smart card (and its reader) and a removable hard drive for general-purpose storage. The tokens used in our study contain 64 MB of storage and embed the same smart card IC found in the smart card and base token. The "advanced" USB tokens' additional mass storage resource motivated our decision to include these tokens in our testing. We were interested in discovering whether usability Figure 12-1. The three form factors deployed in the usability test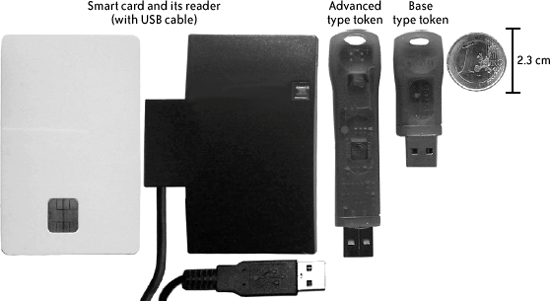 could be enhanced by deploying, in a single hardware device, not only cryptographic material but also software and data on how to use the software (e.g., installation software). On the other hand, smart card IC and mass storage components are isolated; therefore, this additional functionality does not introduce security vulnerabilities to the smart card IC. (Figure 12-2 shows a schematic diagram of both types of tokens.) Figure 12-2. Schematic diagram of base and advanced USB tokens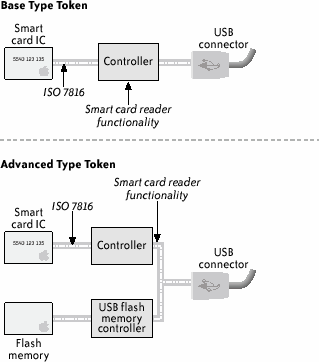 Except for low-level drivers, all three form factors share the same middleware (e.g., Microsoft CAPI). The software used in the study was Microsoft Outlook Express running on the Windows XP and Windows 2000 operating systems. These were chosen so that users would see no difference at the software level while using any of the three devices. Furthermore, given the standard interfaces between the application-level software and the devices provided by the middleware, the specific devices used in these experiments could just as well be replaced by any other cryptographic smart card or cryptographic USB token (so long as this replacement provided the same standards-compliant middleware). The outcome of this usability evaluation applies, therefore, to any specific instance of these kinds of devices. The social context, or "setup," for the user tests draws inspiration from the work of Whitten and Tygar.[26] Each participant was told to imagine that they were responsible for the preparation and launch of an advertising campaign to promote a new product. Tasks for this job position included frequent travel between the different company sites, and most of the material to be delivered for the campaign had to be sent to colleagues through emails. Given the high competition in the market targeted by the new product, a strong level of security protection was demanded on all email communications. To this end, we prepared a cryptographic device with the user's personal digital certificates. The imaginary company provided a technical support team to assist the user, should any trouble arise with the device. However, the subject's manager advised the subject to minimize calls to the support team, as it had limited staff.
This scenario motivates users to actively "protect some secret they consider worth protecting."[27] and includes the use of security while carrying out certain tasks, as opposed to instructing participants "to perform a security task directly."[28] Indeed, security itself is not a user function. The user wants to send a protected email, not use an encryption algorithm. This means that security tools and devices should be integrated seamlessly into the applications.
The test's active participants were the user and the supervisor (experimenter). The supervisor had the following roles:
12.4.3. User SelectionWe selected 10 participants for the user test. All were in their second or third year of undergraduate studies at an engineering college. While all were skilled in the use of email and computers, none had any previous experience with securing email or cryptographic devices. 12.4.4. Task DefinitionThe user test consisted of the following three phases:
12.4.5. Measurement ApparatusFigure 12-3 lists the metrics we defined for this experiment and compares their relationships with the usability attributes. For example, the number of requests to customer service and the time for sending email contribute to the "low cost to operate" attribute value. Figure 12-3. Metrics and their relationships to usability attributes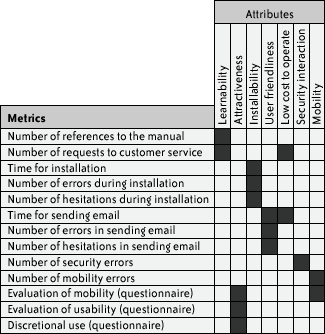 The following provides clarification of some of the metrics:
12.4.6. Processing for Statistical SignificanceAfter all users completed the experiment, the collected data was processed to assure its statistical significance. Where applicable, the measured results were processed to compute the mean value and the standard deviation. Given a set of three mean values (and the associated standard deviations) coming from a metric applied to the three devices, we computed the t-test to each couple of values. This procedure tested the statistical significance of the differences. Using a student's t distribution and assuming two populations with different standard deviations and 10 samples for each population (10 participants for each device), we computed the samples' reference variance, the degrees of freedom, and the t value. Then we used a t distribution table (mapping the value of t and the degrees of freedom to the probability) to find the significance level of the difference between the two mean values. We applied this procedure to each applicable metric. Figures 12-4, 12-5, 12-6, 12-7, and 12-9 show some examples of these measured values, their standard deviations, and the related probability levels. 12.4.7. Computation of the Quality Attributes ScoresNext, we processed the data to compute the quality attributes scores. The computation had to take as input the whole set of values coming from a number of metrics. Some metrics provided quantitative values (e.g., the mean time required for a user to send an email); others were based on qualitative evaluations (e.g., the subjective perceptions relative to ease of mobility). We computed the end data through the use of interpretation functions, which map the measurement values (e.g., the mean time is 3 minutes) onto merit values (e.g., the mean time is high), and integrated a number of merit values into a unique score. The computation is composed of the following two steps:
Note that this procedure is somewhat arbitrary. Nevertheless, it does provide a global quality profile that may be used to present the results and discuss them together with specific, more relevant quantitative measures. 12.4.8. Results and InterpretationFigure 12-4 shows the mean time the subjects needed to perform each one of the three email protection tasks. We noticed that using the smart cards took about twice as long as using the tokens; the existence of more than one hardware piece and the user's need to connect them properly were the main reasons for this result. This difference is certainly exacerbated by the nomadic nature of the user test; in a real-life situation, a user would probably be configuring the smart card at a familiar workstation, thus decreasing task time. Nevertheless, considering that this result is the average of the three executions, and also considering that we could anticipate difficulties, and therefore a longer execution time, on the first trial, it is surprising that the measured time spent on the second and third smart card trials is still significantly higher than for the USB tokens. In fact, the slowdown in smart card task completion is the result of many repeated user errors inserting the smart card in the reader. Figure 12-4. Mean time required for a user to send three protected emails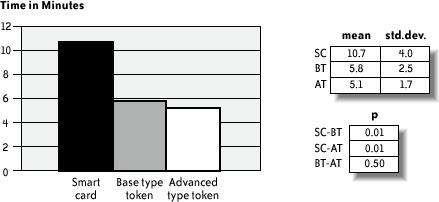 In Figure 12-4 (and Figures 12-5, 12-6, 12-7, and 12-9), std.dev. is the standard deviation of the collected data (10 users); mean is the mean of the collected data; p is the significance level of the difference between the mean values for two devices; SC, BT, and AT denote, respectively, the smart card, the base type token, and the advanced type token. Figure 12-5 depicts the mean number of user requests to "customer service" in order to complete all tasks. Out of a total of nine requests, seven occurred while subjects were using the smart card. Most queries to "customer service" resulted from confusion users had regarding the hardware pieces they had to handle: the smart card and the reader. For example, it was not obvious when to insert the smart card into the reader, or how the reader, smart card, and computer had to be interconnected. Figure 12-6 shows the mean number of errors that occurred while sending three protected emails. Figure 12-7 shows the mean number of mobility errors that occurred while completing the tasks on the three sites. Figure 12-5. Mean number of requests to "customer service" to complete all tasks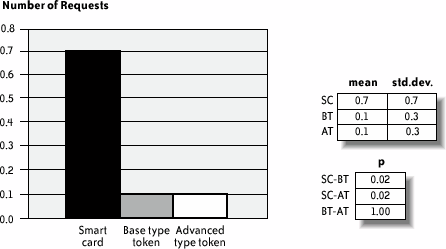 Figure 12-6. Mean number of errors that occurred while sending three protected emails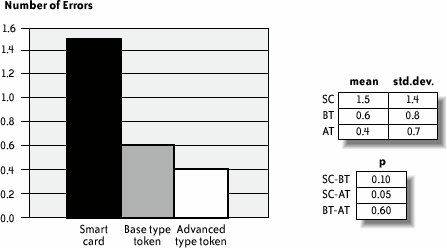 Figure 12-7. Mean number of mobility errors that occurred while completing the tasks on the three sites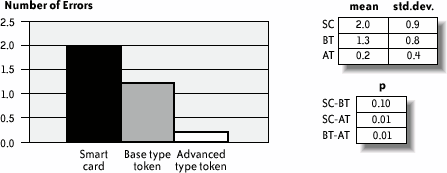 The overall impact of these errors on the test scenario can be estimated by considering the entire number of single tasks involved. For example, the test case for sending protected emails required the user to send at least three emails for each device. More than three emails per user were actually sent because users failed to send the first as expected. Considering the average total of 3.5 email tasks per user and per device, the frequency of errors is 43% for smart cards, 20% for the base tokens, and 9% for the advanced tokens. Similarly, the mobility task involved in moving among workstations averaged about 4.17 times among the three devices. The percentage of error is, in this case, 42.6% for smart cards, 27.7% for the base tokens, and 4.3% for the advanced tokens. In retrospect, we could have anticipated this difference of errors for the mobility task as a consequence of the difference in the number of pieces users had to carry. However, the large difference for the email protection task is somewhat unexpected. To analyze this result further, Figure 12-8 reports the types and frequencies of errors that occurred while subjects were using the smart card. Figure 12-8. Type and frequency of errors while using the smart card for protecting emails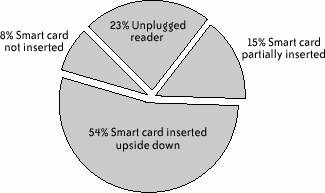 In fact, 69% of these errors occurred because users inserted the smart card in the reader incorrectlyeither upside down or incompletely. Users queried customer service about half of these times, and in the other half were able to correct the error independently. Figure 12-9 shows the mean number of security errors that occurred while completing the tasks on the three sites. The result is the reverse of common-sense expectations: indeed, one could expect that because the software and smart card IC are identical for all three devices, little or no substantial difference should be found. However, the numbers reveal a different situation: of a total of 35 security errors, 21 occurred while using smart cards, 9 while using the base tokens, and only 5 while using the advanced tokens. Users executed a total of 230 email and mobility tasksthese 35 security errors represent 15% of this total number. Most of the errors were the result of users connecting the devices improperly, or failing to bring along the hardware when moving to a different location. Only five errors were the result of the user's failure to explicitly request signature and encryption, either because the user forgot or because the email software client failed to make the user aware of it. This result indicates further that the number of hardware components users must deal with increases complexity and decreases security. Figure 12-9. Mean number of security errors while completing all tasks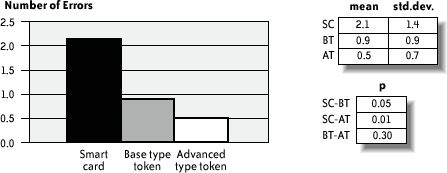 The advanced token appears to be the least error-prone of the devices, for obvious reasons. Because it is a single hardware piece and is thus self-sufficient for carrying out every task, users were less likely to forget it. Test participants also praised the advanced token's mass storage functionality; perhaps participants cared more about this object because it had a greater value to them. The few errors that occurred with the advanced token appeared to be linked to installation; because the token is bundled with its own installation software, users plugged it in as soon as they reached a new locationthus, they had already plugged it in for the email protection task. It is worth further investigation to determine whether the advanced token does indeed provide better usability in contexts where, for example, installation can be carried over from a network, or when installation is not needed at all. On the other hand, contexts in which the software using the cryptographic device (a) cannot be assumed to be available in the host machine and (b) can be executed from the filesystem on the device itself (without the need for a specific installation step) are likely to exhibit better usability for the advanced token. The last component of the experiment was a debriefing questionnaire, which included some questions about how well the users comprehended the suggested context, and other questions about the users' perceptions of the devices' attributes. The three main questions were:
Figure 12-10 shows the outcome of the questionnaires. The advanced token scored very well, obtaining excellent scores for mobility and usability (a, left). The base token obtained good scores, particularly for usability. The smart card had low scores for mobility and medium for usability. In the last question, 70% of users chose the advanced token as their preferred device, while 30% chose the base token (b, right). No user chose smart cards. Figure 12-10. Results of the debriefing questionnaire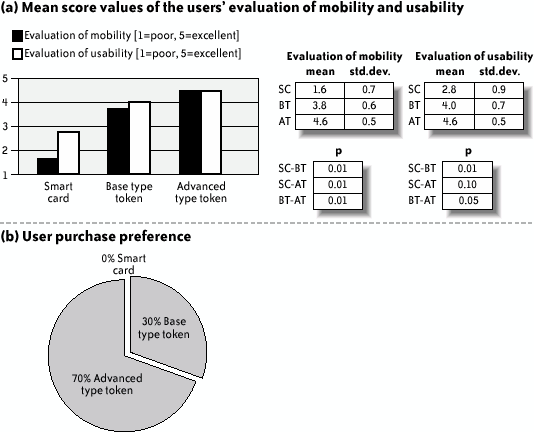 Figure 12-11 provides a graphical summary of the usability attributes scores. While the procedure used to compute them is arbitrary (see the section "Computation of the Quality Attributes Scores" earlier in this chapter), they nonetheless give a global view of the usability evaluation. Figure 12-11. Comparison of the usability attributes of the three form factors; attribute scores are between 1 (poor) and 7 (excellent)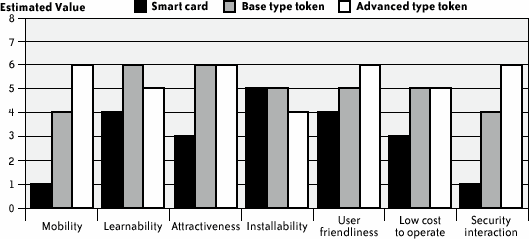 12.4.9. Some Initial ConclusionsThe smart card form factor is familiar to millions of people, and the USB token is not. The experimental results reported here, however, indicate that familiarity does not translate into good usability and security, at least when the smart card is used actively for security purposes on present-day computers. Indeed, current smart card deployment often seems to ignore a simple but hardly surprising usability issue: correct card insertion. For example, the graphics printed on an Amex Blue or Target smart card do not provide users with a clear visual clue about which side and edge need to be inserted into the reader. Further, many smart card readers do not offer users clear visual feedback when the smart card is positioned properly. The introduction of visual clues printed on the smart card, as well as good visual feedback from card readers, would likely limit the usability problems related to proper smart card insertion. USB tokens' better usability is rooted in their relatively small number of components, as well as the usability of the USB connector (there is only one way to plug in a USB device). In addition, the advanced tokens' better results are linked to a side effect of a software usability issue in the email client: the token was already plugged in because of its use in installation. In other words, it bypassed the failure of the software to remind users to insert the device for signing emails. Let's not forget, however, that the usability of these form factors is a systemic property, and is affected by the software using each device. Email client software, for example, should check and give warnings to users regarding the usage of cryptographic devices; it should also check and give specific feedback that the device is plugged in and, therefore, that the certificate and the associated private key are available for email signature. Reminding users to unplug a security device when they finish a session (e.g., at logoff or closure of the email software client) could also help users to remember to carry along their cryptographic credentials. Smart card login and automatic logoff might reinforce the metaphor of the cryptographic device as a door key, thus helping to limit this usability issue. Further addressing this issue might also increase security, as security can be in danger if users forget their cryptographic devices. |
EAN: 2147483647
Pages: 295