Step 3: Match People With Employment Choices And Move On
The final step is to match every employee in the department with one of the four employment options. In considering this analysis, managers must begin with two quick checks. First, they must consider the transaction cost associated with each option listed in Table 6-3. Note that only the layoff has a significant transaction cost associated with it. (See Chapter 5.) In this case it has been estimated that it will cost 25 percent of an employee’s annual salary to lay that person off (based on real case studies). The figure includes separation costs such as outplacement services, accrued vacation, and severance packages. Costs associated with the other options will be nil.
| Action | Transaction Cost (as a Percentage of Salary) |
|---|---|
| Layoff | 25% |
| Job share | 0% |
| Special assignment | 0% |
| Retain as regular employee | 0% |
| Action | Gross Savings | Transaction Cost | Net Cost Savings |
|---|---|---|---|
| Layoff | 100% | 25% | 75% |
| Job share | 50% | 0% | 50% |
| Special assignment | 30% | 0% | 30% |
| Retain as regular employee | 0% | 0% | 0% |
Next a table should be prepared for expressing the net cost savings for each action (Table 6-4). The layoff option, for example, will result in gross savings of 100 percent of an employee’s current salary. The net cost savings will be the gross savings of 100 percent less the transaction cost of 25 percent, or 75 percent.
The IT manager is now ready to begin an employee-by-employee analysis as appears in Table 6-5.
| Information Technology Department | |||||||||||||
|---|---|---|---|---|---|---|---|---|---|---|---|---|---|
| Technical Skills Rating | |||||||||||||
| Employee | Job Title | Time | Time | Last 3 | 1 | 2 | 3 | 4 | 5 | 6 | 7 | Tot | Current |
| M.Burr | Sr.Systems Analyst | 4 | 10 | 3-3-3 | 3 | 3 | 4 | 3 | 4 | 3 | 3 | 23 | $44,000 |
| E.Larty | Sr.Systems Analyst | 4 | 6 | 3-4-3 | 5 | 2 | 4 | 2 | 4 | 3 | 5 | 25 | $43,000 |
| R.Boyd | Systems Analyst | 2 | 6 | 4-4-4 | 4 | 3 | 4 | 4 | 5 | 4 | 4 | 28 | $38,600 |
| S.Bruno | Systems Analyst | 1 | 3 | 4-5-4 | 3 | 3 | 4 | 3 | 4 | 3 | 3 | 23 | $35,300 |
| D.Evtag | Systems Analyst | 1 | 3 | 5-4-3 | 3 | 3 | 3 | 2 | 2 | 2 | 2 | 17 | $39,300 |
| C.Johns | Systems Analyst | 1 | 1 | 5 | 5 | 4 | 4 | 4 | 5 | 5 | 5 | 32 | $36,200 |
| M.Morco | Systems Analyst | 2 | 4 | 2-4-3 | 2 | 2 | 3 | 2 | 3 | 2 | 3 | 17 | $32,500 |
| D.Trever | Systems Analyst | 1 | 1 | 3 | 2 | 2 | 3 | 2 | 3 | 2 | 2 | 16 | $37,100 |
| G.Wang | Sr.Network Analyst | 5 | 8 | 5-5-4 | 4 | 5 | 5 | 5 | 4 | 5 | 5 | 33 | $55,000 |
| B.Turco | Network Analyst | 2 | 2 | 3-3 | 3 | 2 | 4 | 2 | 5 | 3 | 3 | 22 | $45,200 |
| M.Fontaine | Sr.Customer Support Spec. | 9 | 18 | 3-3-3 | 4 | 3 | 4 | 3 | 3 | 3 | 2 | 22 | $34,700 |
| B.Hungo | Customer Support Spec. | 10 | 15 | 3-3-3 | 3 | 3 | 2 | 2 | 3 | 3 | 2 | 18 | $34,500 |
| M.Moroney | Customer Support Spec. | `8 | 12 | 4-4-4 | 4 | 5 | 4 | 4 | 3 | 4 | 4 | 28 | $28,600 |
| G.Sartee | Customer Support Spec. | 6 | 6 | 4-4-4 | 4 | 5 | 4 | 4 | 3 | 4 | 4 | 28 | $30,200 |
| F.Truncheon | Customer Support Spec. | 6 | 6 | 3-2-3 | 2 | 2 | 3 | 2 | 3 | 3 | 2 | 17 | $27,100 |
| R.Younger | Customer Support Spec. | 1 | 1 | 5 | 4 | 3 | 4 | 4 | 2 | 4 | 2 | 23 | $31,000 |
| $592,300 | |||||||||||||
The following information will be needed for each employee:
-
Job title gives the job assignment, the role the person is playing in the IT department.
-
Time in the department and time in the company provide information on longevity or tenure (something that is not of prime consideration but still may be of some importance to the manager in making choices).
-
Last three performance ratings—indicate the past performance effectiveness of the employee.
-
Current pay is the employee’s current annual salary rate.
-
Technical skills rating — There are seven ratings that must go into the manager’s judgments (see Table 6-1):
-
Software languages: Proficiency in basic languages to develop software.
-
Operating systems: Proficiency in customer operating systems.
-
Hardware systems: Proficiency in customer platforms.
-
Databases: Proficiency in databases to support applications.
-
Applications: Proficiency in customer-driven applications (e.g., business development, policy issue, claims).
-
Network administration: Proficiency in developing and maintaining systems on network platforms.
-
Project management: Capability to manage project teams.
*Only salary costs are considered in this example.
Assessments on these seven criteria are probably the only information that cannot be supplied to the manager making the assessment. Managers may, as a result, have to make this assessment on their own. To do so, consider the following:
Step 1 : Develop a five-point scale to assess an employee’s level on each skill, for example:
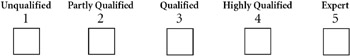
Step 2 : Be careful to develop detailed descriptions of unqualified, partly qualified, qualified, highly qualified, and expert for each skill area.
Step 3 : Rate each employee on each of the seven skill areas. The result will be a technical skill rating for each employee on each skill. Enter the data in the spreadsheet.
Step 4 : Calculate the total points earned in the technical skills rating for each employee. The result will be an overall technical skill rating for each employee.
The overall technical skill rating will be especially important because the manager will want to make sure that those employees who will best embody the seven competencies critical to IT’s processes will be identified. They are absolutely essential to the IT department’s functioning and, ultimately, contribution to the insurance company’s mission and survival. These calculations should take no more than a few hours for the 16 people in the example.
Putting yourself in the position of the IT manager, get ready to use the spreadsheet in Table 6-5 to make the choices. It may take two or more rounds to reach the goal. Balance concerns of skill level, performance, and time either in the department or in the company. It’s important to find a placement among the four options (retain, job share, temporary assignment, lay off) that will enable the firm to reduce 25 percent of its employment costs while keeping those most critical to the operation. Prioritize criteria as described earlier in this chapter: First, do a skill rating; second, conduct a performance rating; third and last, consider time in the department or company.
The results of the first pass are presented in Table 6-6. First, it is decided that that Boyd and Bruno are both systems analysts with some experience and excellent performance ratings. Most managers wouldn’t want to lose either. They both have the competencies needed. Perhaps they will both be amenable to share the job, at least for several months, until the business turns around. Make note again that this option will only work if they are willing to accept the notion and work together.
Moving on, the managers note that Evtag has little experience in the department and his competence ratings aren’t that high. In addition, Morco, Turco, and Truncheon have relatively low performance ratings and do not have high scores with respect to the competencies needed. Those four are probably the best candidates for layoffs. Finally Fontane and Younger are candidates to job share.
It now can be calculated how much will be saved if the plan in Table 6-6 is executed. Salary costs are cut 30 percent. Moreover, this is a conservative figure because benefits costs saved by the layoff have not been factored in. To make the forecast even more accurate, managers may want to bulk up the salary savings by 30 to 40 percent (the additional cost of benefits) in their calculations for those who are laid off.
| Employee | Action | Salary | Factor | Net Savings |
|---|---|---|---|---|
| D. Evtag | Layoff | $39,300 | 75% | $29,475 |
| R. Boyd | Job share | $38,600 | 50% | $19,300 |
| S. Bruno | Job share | $35,300 | 50% | $17,650 |
| M. Morco | Layoff | $32,500 | 75% | $24,375 |
| B. Turco | Layoff | $45,200 | 75% | $33,900 |
| F. Truncheon | Layoff | $27,100 | 75% | $20,325 |
| M. Fontaine | Job share | $34,700 | 50% | $17,350 |
| R. Younger | Job Share | $31,000 | 50% | $15,500 |
| Total savings | $177,875 | |||
| As percentage of budget | 30% |
The 30 percent savings exceeds the 25 percent that had to be cut. So smart managers go to a second round of analysis to retain more human capital and still get the 25 percent of compensation costs out.
Some other changes should be considered. Instead of laying off Turco, he might be able to be put on a special assignment. He’s the only network analyst in the department (other than G. Wang). Putting him on assignment retains those skills. In addition, M. Fontaine and R. Younger seem more critical to retain. Rather than sharing a job and going down to half time, the managers try to find special assignments for them that will allow both to stay employed at a 70 percent level. This second strategy is considered and the resulting cost savings appear in Table 6-7.
The analysis is now complete. There is a way to get 25 percent of the cost out of the unit while maximizing the retention of valued human capital.
The last task for the managers is to confer with each employee so that the layoffs and transition to any new roles run as smoothly as possible. Finally, it is time for everyone to move on into their new roles.
| Name | Action | Salary | Factor | Net |
|---|---|---|---|---|
| D. Evtag | Layoff | $39,300 | 75% | $29,475 |
| R. Boyd | Job share | $38,600 | 50% | $19,300 |
| S. Bruno | Job share | $35,300 | 50% | $17,650 |
| M. Morco | Layoff | $32,500 | 75% | $24,375 |
| B. Turco | Special assignment | $45,200 | 30% | $13,560 |
| F. Truncheon | Layoff | $27,100 | 75% | $20,325 |
| M. Fontaine | Special assignment | $34,700 | 30% | $10,410 |
| R. Younger | Special assignment | $31,000 | 30% | $9,300 |
| Total savings | $144,395 | |||
| As percentage of budget | 24.4% |
EAN: 2147483647
Pages: 143