Exploring the Project 2002 Application Window
|
|
Microsoft Project is somewhat of a hybrid of Microsoft Outlook and Excel, in that it uses Outlook-like tasks and schedules along with Excel-like grids and charts. If you’re using Project for the first time, it won’t take long to find your way around.
When you first launch Project, you see the Project application window in the Project Guide view, as shown in Figure 5.1. At the top of the screen, you see the customary title and menu bars, followed by the Standard and Formatting toolbars side-by-side on a single row. Underneath those toolbars is the new Personal Guide toolbar that you use to control the contents of the task pane on the left.
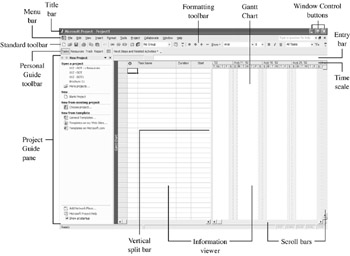
Figure 5.1: The Project Application window shares features of other Microsoft Office applications.
The bar underneath the toolbars is the Entry bar. Similar to Excel’s Formula bar, the Entry bar is used to enter and edit text.
On the left side of the application window is the Personal Guide pane. You can switch this pane on and off with the Show/Hide Project Guide button on the Project Guide toolbar.
The Information Viewer or project worksheet, which is located in the main part of the application window, displays different information depending on the view you choose. The default view is the Gantt Chart view. In this view, you see a task list on the left and a graphic image of a Gantt chart on the right. If you’re new to Gantt charts, don’t worry—as you work through this book, you’ll have plenty of opportunity to see them in operation.
The Vertical Split bar divides the two sides of the Information Viewer. You can point to the Vertical Split bar and then drag it in either direction with the two-headed resize arrow to see more of either side of the Viewer.
At the bottom of the application window is a status bar and a horizontal scroll bar for each side of the Information Viewer. The status bar is a great place to find out if you have the Num Lock, Caps Lock, Scroll Lock, and Insert/Overtype keys turned on. And coming full circle, you’ll find the vertical scroll bar on the right side of the application window.
Opening More than One Project
Project 2002 is similar to Office XP in that it employs the SDI (Single Document Interface) paradigm for managing open windows. SDI essentially means that each document window operates independently of the application. The biggest advantage of SDI is that every open project appears on the Windows Taskbar; each appears with the appropriate application icon. This makes it easy to switch between projects without having to access the Window menu to see what’s open.
When you want to close one project and leave Project running, click the Close button at the far right of the menu bar (second row) of the window control buttons, as shown here:
| Warning | Unlike the SDI in other Microsoft Office applications, clicking the Close button on the Title bar in Project closes the Project application as well as any open projects. |
Working with Menus and Toolbars
When you start any new application, we always recommend that you take a few minutes to familiarize yourself with the menu and toolbar options. This is an excellent way to find the features you are already familiar with and the ones that are part of the application. If you’ve worked in Office, you’ll probably recognize a number of toolbar buttons; as a result, you already have a clear idea of what those options can do for you.
One important thing to know about Project’s toolbars is that, by default, only some of the toolbar buttons are immediately available. The traditional Standard and Formatting toolbars share one row, as shown in Figure 5.2, and only the buttons used most are displayed. You can distinguish where one toolbar ends and another begins by locating the double right-arrows and the vertical selection bar.
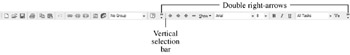
Figure 5.2: The default Standard and Formatting toolbars share a single row.
The double right arrows (More Buttons) indicate that there are more buttons available. Click this indicator at the end of any toolbar to see the additional button choices:
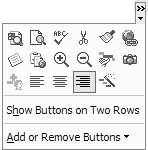
To use one of the buttons listed on the More Buttons menu, click it just as you would on any toolbar. The tool becomes active, and the button moves to the visible toolbar. In the process, it displaces another button to the More Buttons menu. Project determines what button to replace, based on whether or not you have recently used the button and whether the button is frequently used.
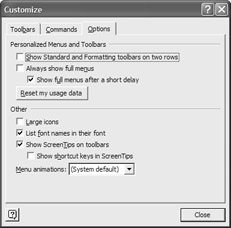
You can turn off this “partial— toolbar feature by selecting View Ø Toolbars Ø Customize to display the Customize dialog box. In the Options tab, select the option Show Standard and Formatting Toolbars on Two Rows. Click Close, and the Standard and Formatting toolbars will appear on separate rows, with all buttons visible.
| Tip | You can also separate the two toolbars—giving each its own full row—by dragging one to the row underneath with your mouse. |
| Note | Project also enables you to create your own custom toolbars; see Chapter 23 for more information. |
You can also configure Project’s pull-down menus to display only the most recently used commands. To switch on “partial— menus (or what Microsoft calls “personalized menus”), select View Ø Toolbars Ø Customize to open the Customize dialog box; then select the Options tab. Deselect the Always Show Full Menus option—and, if you want the new, shortened menus to eventually display the hidden commands, check the Show Full Menus After a Slight Delay option. Click Close to register this new configuration.
If you choose to use the shortened menus, you can view any hidden commands by clicking the down arrow at the bottom of the menu.
Using the Project Guide
New to Project 2002 is the Project Guide, a task-based pane that can be displayed on the left side of the Project application window. This pane resembles the task-based panes used in Microsoft Office XP, and in Windows XP folders. You display the Project Guide pane by clicking the Show/Hide Project Guide button on the Project Guide toolbar that appears under the Personal toolbar.
![]()
Click the button again to hide the pane.
There are actually four different Project Guide panes, each dedicated to a particular set of operations. You switch between the panes from the Project Guide toolbar. The operations contained in the Project Guide panes are similar to miniature wizards in that they lead you step-by-step through the specific operations. Click the link for a specific operation and then follow the instructions that appear in the task pane. The following are descriptions of the Project Guide panes:
-
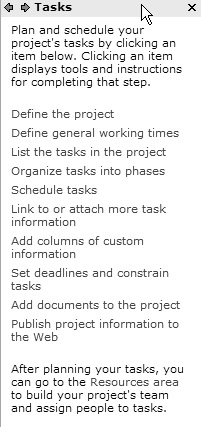
Tasks, which includes operations for defining your project and organizing and scheduling tasks
-
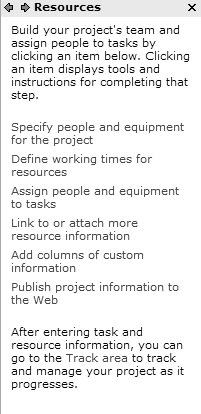
Resources, which includes operations for assigning and managing your project resources
-
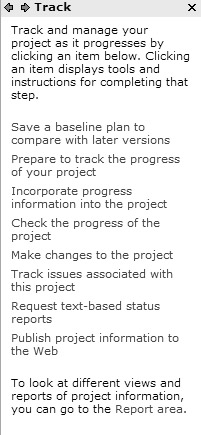
Track, which includes operations for managing the progress of your project
-
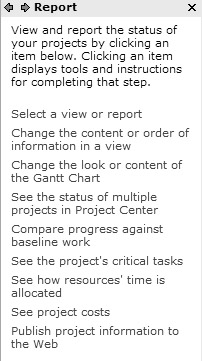
Report, which includes operations for creating and publishing various Project reports
| Note | There is a fifth task pane in the Project Guide—the New Project pane that appears whenever you launch Project or a new project within the application. |
The Project Guide menu also includes a pull-down menu called Next Steps and Related Activities. This menu includes all the operations listed on the individual Project Guide panes.
If you’re new to Microsoft Project or project management, you can use the Project Guide to help determine what you need to do at each step of a project. If you’re a more experienced user, you may want to hide the Project Guide pane by clicking the Show/Hide Project Guide button.
Changing Views
Views allow you to examine and work with a project from all different angles, focusing on the information that is important to you at any given time; however views in Project are not just ways to see the same data. Views come in several varieties: Some are used to enter data while others are used to analyze data. Some views combine different types of data to help you make decisions about the project’s status.
Project views can generally be categorized into two primary types: Task views and Resource views. Task views include views in which the focus is on entering and reviewing task information: tasks, duration, start dates, finish dates, predecessors, and other similar information. Resource views include views related to assigning and tracking the use of human resources, materials, and equipment used to complete the project. A resource can be an individual, company, department within a company, team, piece of equipment, room, or any other resource you need for the project.
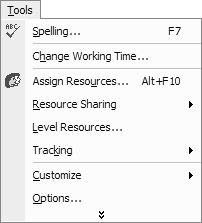
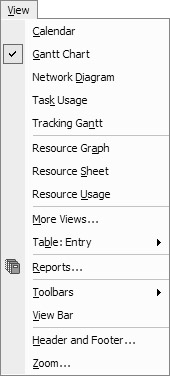
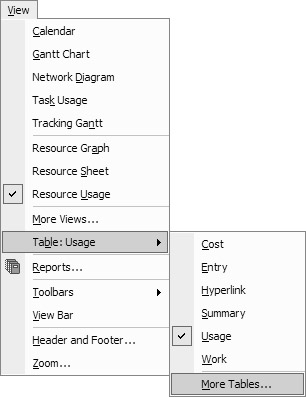
You switch views from Project’s View menu, shown here:
The Task Views
Calendar view is a familiar way to look at tasks. Project displays a traditional monthly calendar with tasks represented by bars spanning the days on which they are scheduled.
Gantt Chart view is the default view. In Gantt Chart view, you can work with task information in both text and bar graphics format: entering new tasks, establishing relationships between tasks, and assigning personnel and resources to tasks.
Network Diagram view, shown in Figure 5.3, displays the project’s tasks in a flowchart and shows relationships between tasks. A box or node represents each task, and includes several data elements such as duration, start and finish dates, and percent completed.
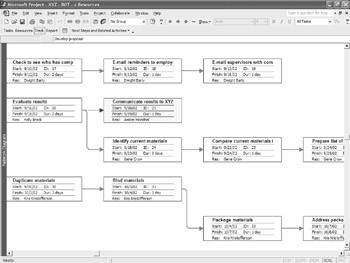
Figure 5.3: Network Diagram view
Task Usage view focuses on how much work each resource has completed over time. In this view, you can also compare actual work and costs to budgeted work and cost.
Tracking Gantt view is similar to the traditional Gantt Chart view, but it compares baseline start and finished dates to scheduled start and finish dates, or to the percentage of the work that has already been completed.
The Resource Views
Resource Graph view offers a graphical representation of the way resources, work, and costs of resources are allocated over time.
Resource Sheet view provides a summary of information about resources in a spreadsheet format. In this view, you can enter and review information about payment rates.
Resource Usage View, shown in Figure 5.4, groups tasks by resources so you can easily see when someone is committed and how long they will be involved in specific tasks. It also displays the amount of work, work allocation, and work availability for each resource.
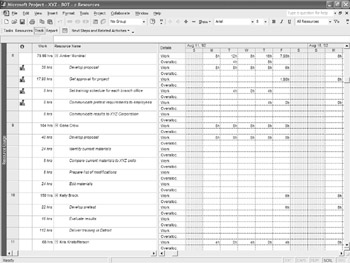
Figure 5.4: Resource Usage view
| Note | Additional views are available by selecting View Ø More Views. This opens the More Views dialog box, shown in Figure 5.5. All of the views can be modified to display different data fields, and you can include filters to focus on just the information you want to see. For more about creating custom views, refer to Chapter 16. |
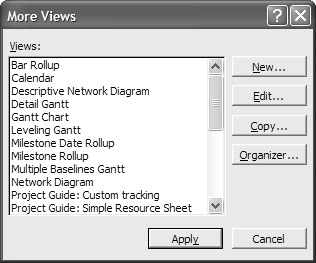
Figure 5.5: Plenty of other views are available in Project, and you can modify them as needed.
Applying Tables to Views
In addition to Project’s views, each view has a number of tables that you can use to display various fields of data. For example, the default view is Gantt Chart view and the default table (on the left side of the window) is the Entry table. In the Entry table you have fields (columns) such as Duration, Start, and Finish. If you apply the Cost table to the Gantt Chart view, the fields change to Fixed Cost, Fixed Cost Accrual, and Total Cost. To change tables, select View Ø Table and then choose a specific table type. Even more tables are available when you choose the More Tables option from this submenu.
| Note | As you work through the chapters in this book, you will have the opportunity to work with many of Project’s views and tables, so don’t worry if they are a bit overwhelming right now. |
|
|
EAN: 2147483647
Pages: 241