Analyzing Business Requirements for the Solution
| After completing your analysis of the current business state, it's time to turn your attention to gathering requirements for the business solution. To successfully determine business requirements for the solution, several questions need to be answered. These questions focus on areas such as the following:
To successfully answer these questions, you must focus your attention on five major tasks:
Identify System FeaturesOne difficulty you might encounter during the business requirements analysis phase is users not knowing exactly what they want in terms of clear requirements. This is probably not a shock to anyone who has dealt much with users. When users describe what they would like a new system to do, they often convey it in terms too vague to actually be used as system requirements; instead, they express requirements in terms of desired system behavior. Users might tell you "We need to have a better idea of who our customers are" or "We need to try to get our existing customers to order more products throughout the year." These "requirements" are essential to the users, and the need to resolve those issues is probably what initiated the project in the first place, but these needs can't easily be transferred to requirements. High-level expressions of desired system behaviors are called system features, which can be defined as services a system provides to fulfill one or more of the users' needs. Features are not always well thought out, and some features might seem to be in conflict with other features, but they are a representation of real needs. Features are a good way to describe required functionality without getting too detailed. You can think of features as a buffer between what users need and how you will eventually translate those needs/features into business requirements (see Figure 2.1). If you start your requirements discussion with features being the common ground, you have improved your chances of actually developing business requirements that translate into a successful system. Figure 2.1. Features as a buffer between needs and requirements.
Discussing how the users' true needs will be addressed by implementing a feature is essential. If you don't have a real understanding of the true needs, you might not fulfill the users' objective for the new system, even though you implemented the feature they asked for. For example, the feature "We need to have a better idea of who our customers are" can be approached several ways. Based on this feature, you could design a system and create a new database structure with a sophisticated querying capability for users to determine where customers are located, what products they purchase, and how much they spend. Your users can use some of this functionality, but it turns out their real need is to have some way to determine customers' occupations so that they can target mailings to certain occupations. The needs are not satisfied, so you have unhappy users and an inadequate system. You can also use the concept of features to help review and prioritize system requirements. Users will have a better idea which requirements are critical, which are required, and which can be deferred, if you allow them to prioritize them as system features. You can then use this information to prioritize your system requirements. For software being released internally or externally, features are a good way to describe improvements to the software. Whenever software is upgraded, normally you see improvements to the software described as new features. Features are also a good way to communicate the project's purpose to upper management. Gather Business RequirementsAfter you've established the system features, you can turn your attention to actually gathering business requirements. This phase of the process can be divided into three subphases:
Identifying Information SourcesThe initial step in the business requirements-gathering phase must be identifying the sources of information required for this phase. A good place to start is the project sponsor. The project sponsor is the project champion, and he or she usually has a major financial stake in the project and is responsible for the budget. The project sponsor also has some authority to continue or shut down the project, and must understand and support the project's business value. The next group to contact is the current system's business users, so you can discover their needs and turn those needs into project requirements. You need to determine the critical success factors that make it possible for users to do their jobs successfully. Critical success factors are information needs and systems that are crucial for business continuity. You need to understand the users' objectives and challenges and how they go about making business decisions. It's also important to continue to communicate with users as often as possible throughout the requirements-gathering phase. When discussing requirements with users, note that application requirements can change over time and that earlier requirements might no longer meet users' needs at the conclusion of the process. You should verify that the desired application functionality is truly relevant to current business needs. Managing users' expectations and making them aware of the possible impact on their work environment after project implementation should also begin at this time. Classifying and Prioritizing RequirementsAfter gathering the business requirements, you should classify and prioritize them. This classifying exercise should break the requirements down into functional, performance, constraining, informational, and subjective requirements. Some of the requirements from one business unit might contradict the requirements from another business unit. Understanding the importance of the requirements, as well as resolving contradictory requirements, enables you to generate a consolidated set of requirements. Any decision processes can then be based on these requirements. Make sure all key business users agree on the consolidated set of requirements to ensure that no ambiguity exists in the requirements before the design phase begins. Creating a Vision/Scope DocumentThe final step in gathering business requirements is the creation of the vision/scope document. The purpose of this document is to describe the business value of the proposed application, summarize the actual business requirements, review the project's limitations and constraints, and describe the personnel who will be required to take the project through the design phase. The project's business value is expressed by having a complete description of the business problems the project will try to solve and the business benefits that will be realized upon completion of the project. Quantitative goals, such as increased sales, new products to be offered, and new markets that will be available, should be described. It's also important to state these benefits to further justify the project's expense. The description of the business requirements includes the business factors driving the project and describes how the new application will change the current way of doing business. An explanation of how the project objectives relate to the strategic corporate goals should also be included. Limitations and constraints, such as project length and resource availability, need to be presented to minimize surprises in later phases. Any open issues or unanswered questions that must be resolved before continuing with the project need to be brought to everyone's attention. You need to identify the roles and responsibilities of the personnel who will be key players in the next phases. For example, if the new application requires a major overhaul of the existing database structure, a key person in the design and implementation phases will be a SQL Server Data Base Administrator (DBA).
Identify Internal and External DependenciesThe third step in the requirements analysis phase is to identify any dependencies that might have an impact on the project's success. A dependency is a form of constraint for any project. There are two types of dependencies: internal and external. An internal dependency is any relationship between two or more activities that could affect scheduling or completing these activities. For example, perhaps you can't create your test databases until Microsoft SQL Server is available on the network. An external dependency is an activity or some event that is outside the direct control of the project, but its satisfactory completion has a direct bearing on whether the project can be completed. For example, another project might need to be completed before a key piece of software that the project requires becomes available. You should be aware that most internal dependencies are a direct result of resource availability. People get involved in other projects, get sick, go on vacation, or quit. If you have identified tasks in your project that depend on a certain person being available at a specific time to work on that task, you have identified an internal dependency. Having alternative resources available or providing adequate training to increase your resource pool can eliminate many internal dependencies. External dependencies are more difficult to eliminate. The nature of an external dependency is that you don't have direct control over resolving the issue that's causing the dependency. As opposed to internal dependencies, which are normally resource driven, external dependencies are usually activity driven. You can try to minimize an external dependency by creating contingency plans, reconfiguring the project plan to allow for longer time frames that resolve those dependencies, or reworking the project to eliminate the dependency entirely. Sometimes all you can do, however, is document the issue, cross your fingers, and hope for the best. Keep in mind that it's probably not necessary to worry about and document every single dependency. On a large project, this could mean tracking literally hundreds of dependencies. The emphasis should be on documenting and attempting to resolve only those dependencies considered critical to the project's success. High-level tasks, deliverables, milestones, or anything on the critical path would require specific attention. Lower-level or less critical tasks would not need special attention, unless a substantial delay has elevated their importance. Remember that schedules are planned with certain assumptions about dependencies, which might later prove to be incorrect. If this happens, you might need to adjust the schedule as well as reevaluate which project activities now have dependencies. Define Data RequirementsThe fourth step in the requirements analysis phase is to define data requirements for the application. You need to determine what business data the organization requires to meet its objectives. Business data is any information an organization needs to function. For most organizations, the information they use to meet their objectives is their most important resource. One method for determining data requirements is data modeling, which is the process of identifying the kinds of data needed for your application and documenting the business relationships among the data. Data modeling involves reviewing existing data models and processes from other applications to see whether they can be reused, and then creating new data models and processes to suit the new application's unique requirements. Data modeling identifies which data is essential and defines the context within which the organization uses and maintains data.
These are the major events in data modeling:
When modeling data, there are five major areas on which to focus:
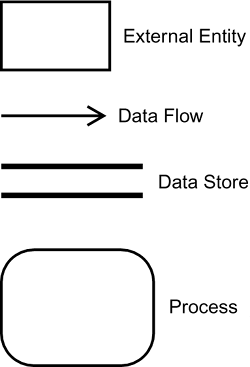
Remember that data modeling is used to describe data and business relationships among the data, yet is still independent of any implementation approach, technology, hardware, or software. At the conclusion of data modeling, you will have a complete definition and an implementation of the application's current data requirements. Create Data Flow DiagramsThe final step in the requirements analysis phase is creating data flow diagrams. A data flow diagram (DFD) is a way of representing a system by using only graphic symbols. A data flow diagram is a logical representation of what a system does, not a physical representation of how it's done. Representing systems with a graphical method instead of just text makes it much easier to describe a system and have others understand it. Think of trying to give someone driving directions. Pictures (maps, in this example) are usually a better way of helping drivers get to their destination. The goal of data flow diagramming is to have a commonly understood model of a system that both users and IT people can use. Users make use of data flow diagrams to verify that the system is being modeled properly; the requirements-gathering team members use them to determine whether they correctly understand the system. Data flow diagrams are a flexible diagramming tool for modeling current as well as future systems. You might ask, "Why do we need to diagram the existing system, if it's being replaced?" The answer is that the best way to determine a new system's requirements is to start with the old system. By understanding what the old system did that the new system still needs to do and what the new system needs to do that the old system didn't do, you have a much better chance of successfully determining the new system's requirements. Drawing data flow diagrams also helps you draw a boundary around the system being modeled. Projects often fail to determine a definite system boundary, which results in projects having an inappropriate scope, thus increasing the chance of failure for the entire project. Data flow diagrams use four symbols: external entities, data flows, data stores, and processes (see Figure 2.5). Figure 2.5. Data flow diagram symbols.
The following list explains the four symbols used when drawing data flow diagrams:
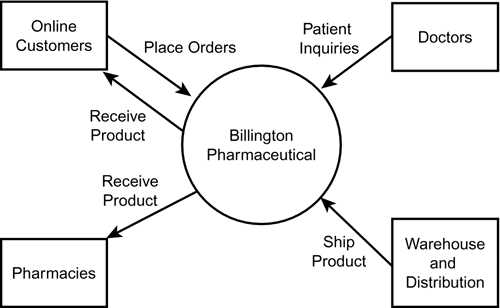
A key to creating data flow diagrams is organizing them in a hierarchical order. Different levels of data flow diagrams show a system in more detail. The first level is the context diagram, which shows the system boundaries, the external entities that interact with the system, and the major information flows between the external entities and the system. Figure 2.6 shows a context diagram for Billington Pharmaceuticals. Figure 2.6. A context diagram of Billington Pharmaceuticals.
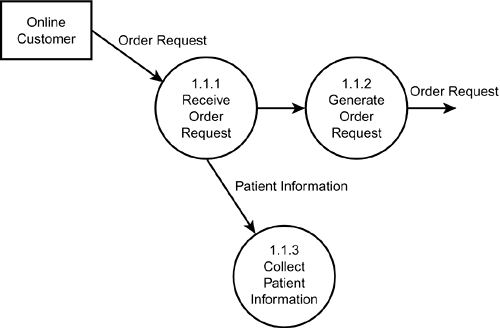
The next DFD level is the level-0 diagram, which shows a system's major processes, data flows, and data stores at a very high level of detail. For example, in a data flow diagram for Billington Pharmaceuticals (see Figure 2.7), you might show these major processes in the level-0 diagram: Process Online Orders, Product Shipments, Accounting and Billing, and Process Doctor Inquiries. Note that each process is given a number. The numbering convention is to use decimal notation1.0, 2.0, 3.0, and so onfor each process. In the case study, the Process Online Orders process would receive the designation of 1.0; Product Shipments, 2.0; and so on. Each level of succeeding detail also follows a numbering convention (explained in the next paragraph). Remember, when specifying the names used to represent a process, be as descriptive as possible. Process names should capture the essential action of the process in just a few words. Figure 2.7. A level-0 diagram for Billington Pharmaceuticals.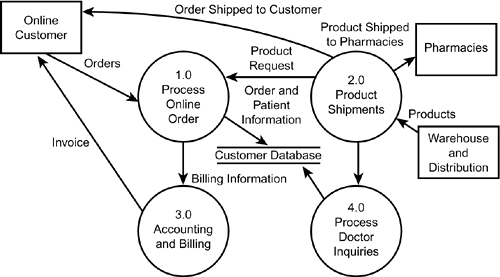 The next DFD level is the level-n diagram, which takes one of the processes from the level-0 diagram and breaks it down further. Using the Billington Pharmaceuticals case study (see Figure 2.8) example again, the level-n diagram for 1.0 Process Online Orders could include these major processes: Receive Online Order, Ship Completed Order, Update Patient Database, and Generate Billing. Using the proper numbering scheme, the Receive Online Order process would be numbered 1.1, the Ship Completed Order process would be 1.2, and so on. The purpose of this numbering scheme is to know where a process originates. If you need to break a process down further, you would add another level of numbering. For example, the 1.1 Receive Online Order process in the Billington system is broken down another level (see Figure 2.9). So the first process, Receive Order Request, is numbered 1.1.1; the second process, Generate Order Request, is 1.1.2; and Collect Patient Information is 1.1.3. You can break processes down as many levels as is necessary. When you no longer need to break a process down further, the lowest level is called a primitive level data flow diagram. Figure 2.8. A level-n diagram for Billington Pharmaceuticals.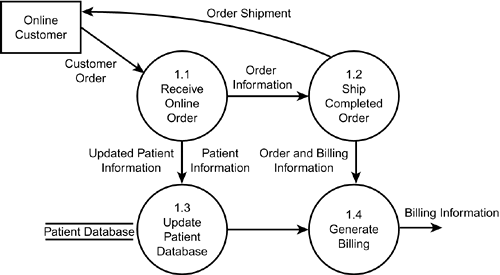 Figure 2.9. A primitive level diagram for Billington Pharmaceuticals.
The process of drawing data flow diagrams should include these steps:
After you've reached the primitive level DFD, you can use other modeling tools, such as Structured English, decision tables, and decision trees, to describe the actual system logic needed to complete the individual process. Structured English uses a subset of English vocabulary to express the processing logic contained in the primitive data flow diagram. Structured English does not use adjectives or adverbs. Decision tables and decision trees are used when the processing logic is too complicated to lend itself to Structured English. Again, remember that names used to represent a process should be as descriptive as possible. Process names should capture the essential action of the process in just a few words, so that anyone could understand what the process does just from seeing the process name. |
EAN: 2147483647
Pages: 175


