Extending the Data Analysis Features in Microsoft Data Analyzer
Microsoft Data Analyzer does not include the Visual Basic Editor that comes with most other Office applications. To program Data Analyzer, you must embed an instance of the Data Analyzer ActiveX control in an instance of a VBA UserForm, a 32-bit Windows form such as a Visual Basic or Microsoft Visual C++ form, or a Web page. You then write code using the hosting application’s corresponding programming language. In the following code sample, included in the Chap11 folder’s ![]() DACode.xls file, a VBA UserForm inside an Excel workbook hosts an instance of the Data Analyzer ActiveX control.
DACode.xls file, a VBA UserForm inside an Excel workbook hosts an instance of the Data Analyzer ActiveX control.
| Note | You must have Microsoft Data Analyzer and Microsoft SQL Server 2000 Analysis Services installed on your computer to run the following code sample. For complete information about programming the Data Analyzer ActiveX control, see the Microsoft Data Analyzer API help file included with Data Analyzer or the Microsoft Developer Network (MSDN) Web site at http://msdn.microsoft.com. |
Here’s the code:
Private Sub Workbook_Open() ’ Open the frmDA VBA UserForm. frmDA.Show End Sub
The Workbook object’s Open event opens the VBA UserForm, referred to as frmDA in the code. The form contains an instance of the Data Analyzer ActiveX control.
‘ Note: You add the Microsoft Data Analyzer ActiveX Control to a ‘ VBA UserForm as follows: ‘ 1. Right-click a blank area of the Toolbox and click Additional Controls. ‘ 2. Select the Max3Ax Class check box, and then click OK. ‘ 3. Drag the Max3Ax icon from the Toolbox to the VBA UserForm. ‘ Note: To write code to customize the control, do the following: ‘ 1. On the Tools menu in the Visual Basic Editor, click References. ‘ 2. Select the Max3API check box, and then click OK. ‘ By default, the control is named "Max3Ax1". ‘ Global Data Analyzer Application object. Public gdaApp As Max3API.Application
Similar to the other Office object models, Data Analyzer has an Application object that can be used to automate the application. The Application object instance (named gdaApp in this case) is declared in the General Declarations area of the VBA UserForm’s code so that it can be accessed from several subroutines.
Private Sub UserForm_Activate() Set gdaApp = Max3Ax1.Application ’ Connect to the sample FoodMart 2000 Sales cube. ’ Change the next line of code to match the Microsoft SQL Server 2000 ’ Analysis Server name. gdaApp.ActiveView.Connect _ ConnectionString:="location=localhost;provider=msolap" gdaApp.ActiveView.Catalog = “Foodmart 2000" gdaApp.ActiveView.Cube = “Sales" ’ Determine the length and color of the bars and pie slices. ’ In this case, length equals unit sales and color equals sales average. gdaApp.ActiveView.TraitsManager.Trait _ (TraitID:=trtLength).SetSingleQuality _ QualityType:=qtypMeasure, QualityID:="[Measures].[Unit Sales]" gdaApp.ActiveView.TraitsManager.Trait _ (TraitID:=trtColor).SetSingleQuality _ QualityType:=qtypMeasure, _ QualityID:="[Measures].[Sales Average]" MsgBox Prompt:="Click one or more of the ’Display...’ “ & _ “buttons at the bottom of the “ & _ “form to display a data view." End Sub
The VBA UserForm’s Activate event is triggered when the UserForm becomes active. Several operations occur inside the Activate event’s code:
-
The Data Analyzer Application object’s ActiveView property refers to the Data Analyzer ActiveX control’s display area, referred to programmatically as a View object. The View object’s Connect method’s ConnectionString argument, along with its Catalog and Cube properties, is used to reference the data source to connect to. In this case, the data source is the Sales OLAP cube in the FoodMart 2000 OLAP database in the locally installed instance of Microsoft SQL Server 2000 Analysis Services.
-
To specify what the view’s member bar lengths and colors represent, the View object’s TraitsManager object is first referenced. The TraitsManager object’s Trait object is next referenced, specifying the trtLength or trtColor constants to indicate length or color settings, respectively. Finally, the specific Trait object’s SetSingleQuality method sets the length or color settings by specifying an OLAP measure. This is done by setting the SetSingleQuality method’s QualityType argument to the qtypMeasure enumerated constant and setting the QualityID argument to the measure name, using Multidimensional Expressions (MDX) syntax.
Note For more information about MDX syntax, see the Microsoft Developer Network (MSDN) Web site at http://msdn.microsoft.com.
In the next three subroutines, the UserForm’s Display Advertising Data button, when clicked, clears any visible dimension panes from the display and then displays the Promotions and Promotion Media dimension panes, as shown in Figure 11-19. To clear all visible dimension panes, the View object’s Aspects collection is referenced, and the Aspects collection’s Clear method is called. To add a dimension pane, the View object’s Aspects collection is referenced, and the Aspects collection’s Add method is called, specifying the OLAP cube’s dimension name for the ID argument.
Private Sub cmdAdvertising_Click() Call DisplayAdvertisingView End Sub Private Sub DisplayAdvertisingView() ’ Purpose: Display time and promotional data. Call ReinitializeView gdaApp.ActiveView.Aspects.Add ID:="[Promotions]" gdaApp.ActiveView.Aspects.Add ID:="[Promotion Media]" End Sub Private Sub ReinitializeView() ’ Purpose: Clear any previous dimension panes ’ and add the time dimension pane. gdaApp.ActiveView.Aspects.Clear gdaApp.ActiveView.Aspects.Add ID:="[Time]" gdaApp.ActiveView.Aspects.Item _ (v:="[Time]").GotoLevel LevelID:="[Time].[Year]" End Sub
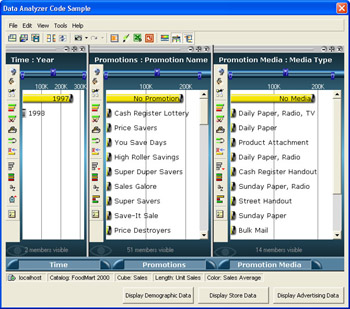
Figure 11-19: Results of clicking the Display Advertising Data button.
The next four subroutines contain code for the UserForm’s Display Demographic Data and Display Store Data buttons, the results of which, when clicked, are shown in Figure 11-20 and Figure 11-21. The code for these subroutines is almost identical to the previous subroutines, except that different dimension panes are displayed in each case.
Private Sub cmdDemographics_Click() Call DisplayDemographicView End Sub Private Sub DisplayDemographicView() ’ Purpose: Display time, education level, gender, and marital status. Call ReinitializeView gdaApp.ActiveView.Aspects.Add ID:="[Education Level]" gdaApp.ActiveView.Aspects.Add ID:="[Gender]" gdaApp.ActiveView.Aspects.Add ID:="[Marital Status]" End Sub Private Sub cmdStore_Click() Call DisplayStoresView End Sub Private Sub DisplayStoresView() ’ Purpose: Display time, store location, store type, ’ and store size in square feet. Call ReinitializeView gdaApp.ActiveView.Aspects.Add ID:="[Store]" gdaApp.ActiveView.Aspects.Add ID:="[Store Type]" gdaApp.ActiveView.Aspects.Add ID:="[Store Size in SQFT]" End Sub
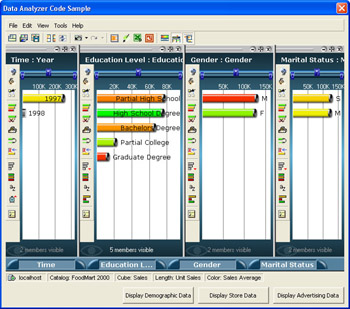
Figure 11-20: Results of clicking the Display Demographic Data button.
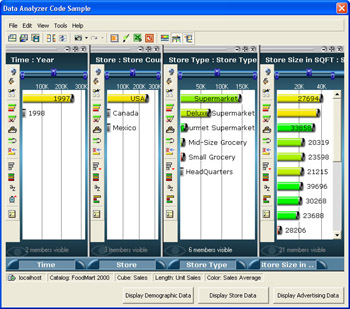
Figure 11-21: Results of clicking the Display Store Data button.
EAN: 2147483647
Pages: 137
- Key #1: Delight Your Customers with Speed and Quality
- When Companies Start Using Lean Six Sigma
- Making Improvements That Last: An Illustrated Guide to DMAIC and the Lean Six Sigma Toolkit
- The Experience of Making Improvements: What Its Like to Work on Lean Six Sigma Projects
- Six Things Managers Must Do: How to Support Lean Six Sigma