Using the PivotTable Component
The PivotTable Component brings many of the features of PivotTable reports to Web pages. Figure 6-9 shows a sample of the PivotTable Component.
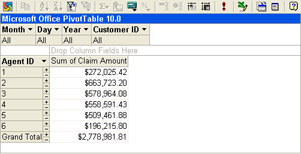
Figure 6-9: The Office XP PivotTable Component.
Here’s a list of some of the controls on the PivotTable Component’s toolbar, shown in Figure 6-10:
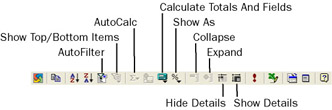
Figure 6-10: The Microsoft Office XP PivotTable Component’s toolbar.
-
AutoFilter places an arrow in each nondetail field. Clicking the arrow displays a list of values that you can use to select the records that match filter conditions.
-
Show Top/Bottom Items (not available in Office 2000) displays only the top or bottom specified number of items.
-
AutoCalc adds a field to the PivotTable field list that represents a summarization, such as Sum, Min, Max, Average, and so on. This field can be dragged to the Detail area of the PivotTable Component.
-
Calculated Totals and Fields (not available in Office 2000) adds calculated totals and calculated detail fields.
-
Show As (not available in Office 2000) displays numerical data as a percentage of totals or items.
-
Collapse (not available in Office 2000) reduces the amount of detail displayed in the PivotTable Component for the selected field.
-
Expand increases the amount of detail displayed in the PivotTable Component for the selected field.
-
Hide Details (not available in Office 2000) hides detail in the Detail area of the PivotTable Component.
-
Show Details (not available in Office 2000) shows detail in the Detail area of the PivotTable Component.
The PivotTable Component, like the SpreadSheet Component, uses the Commands And Options dialog box at design time to set up options for how data is displayed and managed in the PivotTable. Depending on which aspect of the PivotTable you are working with, not all the tabs are visible. Figure 6-11 shows some of the main tabs you’ll work with.
-
The Captions tab controls the appearance and text displayed in the PivotTable Component’s title bar and drop zones. It also displays properties of the component, such as the name of the data provider.
-
The Report tab defines subtotal display behaviors as well as other report display options.
-
The Behavior tab shows or hides viewable display elements, automatically adjusts the size of the control, and determines items and display-expansion behaviors.
-
The Protection tab provides you with greater flexibility for how users can modify the PivotTable Component’s layout at run time by allowing or prohibiting users from interacting with certain portions of the PivotTable Component.
-
The Data Source tab defines data source connectivity information.
-
The Calculation tab (not shown in Figure 6-11) defines formulas for custom calculated totals and detail fields.
-
The Filter And Group tab (also not shown) displays the top and bottom items and determines grouping behavior.
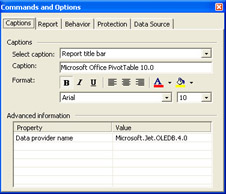
Figure 6-11: The Office XP PivotTable Component’s Commands and Options window (at design time).
The PivotTable Component’s Commands And Options dialog box has other tabs at run time. These tabs are shown in Figure 6-12.
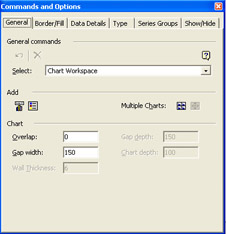
Figure 6-12: The Office XP PivotTable Component’s Commands And Options dialog box at run time. The appearance of the dialog box varies depending on the layout of the PivotTable Component.
| Note | The Office 2000 PivotTable Component’s Property Toolbox looks slightly different from the Office XP PivotTable Component’s Commands And Options dialog box, but many of the features are the same. |
Linking to data from a PivotTable Component is similar to importing data into a Spreadsheet Component. Click the Data Source tab on the Commands And Options dialog box and complete the information to link to the external data.
| Note | In the Office 2000 PivotTable Component in design time, click the Property Toolbox button, click the Data Source tab, and then complete the information in the Property Toolbox to import the external data. |
Analyzing PivotTable Component Data
With data displayed in a PivotTable component, you can perform data analysis tasks on the data. To sort data in the PivotTable Component, click the field name by which you want to sort and then click the Sort Ascending or Sort Descending button.
Your Turn
In this exercise, you want to sort insurance claim totals by agent number so that the highest total appears at the top of the list.
-
In the
 Sales.htm file’s PivotTable Component, click the Sum of Claim Amount field.
 -
On the PivotTable toolbar, click Sort Descending. Compare your results to Figure 6-13. Agent 2 had the highest insurance claim total of $663,723.20.
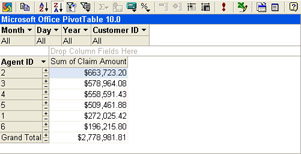
Figure 6-13: Claims by agent sorted by total claims in descending order.
To filter data in the PivotTable Component, click the arrow next to the field name by which you want to filter, select or clear the check boxes to display or hide matching items, and then click OK. Select or clear the All check box to display or hide all of the items.
Your Turn
In this exercise, you will display claims for agent 2 for only the month of January.
-
In the
Sales.htm file’s PivotTable Component, click the arrow next to the Month field. -
Clear the All check box, select the 1 check box, and then click OK.
-
Click the arrow next to the Agent ID field.
-
Clear the All check box, select the 2 check box, and then click OK. Compare your results to Figure 6-14.
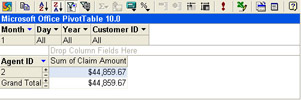
Figure 6-14: Claims for January for agent 2.
To show the top or bottom items in the PivotTable Component (Office XP only), click the field for which you want to show the top or bottom items. On the PivotTable Component’s toolbar, click the Show Top/Bottom Items button, point to Show Only The Top or Show Only The Bottom, and then click the number of items you want to display.
| Tip | Click the Other menu option to provide more specific criteria for selecting top or bottom items. |
Your Turn
In this exercise, you will display the three agents with the largest (top) total claim amounts.
-
In the
Sales.htm file’s PivotTable Component, click the arrow next to the Agent ID field. -
Make sure that all agents are selected by selecting the All check box, and then click OK.
-
Click the arrow next to the Month field, make sure that all months are selected by selecting the All check box, and then click OK.
-
Click the Agent ID field, and then, on the PivotTable toolbar, click Show Top/Bottom Items, point to Show Only the Top, and click Other.
-
In the Display The list, select Top.
-
In the Items list, type 3.
-
In the Based On list, select Sum Of Claim Amount.
-
Close the Commands And Options window.
-
On the PivotTable toolbar, click the Sort Descending button, and compare your results to Figure 6-15.
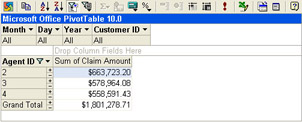
Figure 6-15: Top three agents as determined by total claims.
To insert a summary function into a PivotTable Component, click the field for which you want to insert the function. On the PivotTable Component’s toolbar, click the AutoCalc button, and then click the summary function (Sum, Count, Min, Max, and so on).
Your Turn
In this exercise, you will display the number of claims processed by each agent.
-
In the
Sales.htm file’s PivotTable Component, make sure that all items are showing; on the PivotTable Component’s toolbar, click the Show Top/Bottom Items, and then click Show All. -
Click the Customer ID field.
-
On the PivotTable Component’s toolbar, click the AutoCalc field, and then click Count. Compare your results to Figure 6-16.
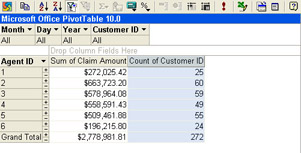
Figure 6-16: Number of claims processed by agent.
To insert a subtotal into a PivotTable Component, click the field for which you want to insert a subtotal. On the PivotTable Component’s toolbar, click the Subtotal button.
Your Turn
In this exercise, you will add a total for all of the agent’s insurance claim amounts.
-
In the
Sales.htm file’s PivotTable Component, click the Agent ID field. -
On the PivotTable Component’s toolbar, click the Subtotal button. Compare your results to Figure 6-17.
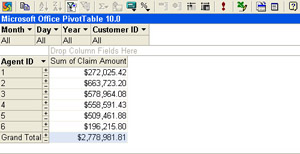
Figure 6-17: Total claim amount for all agents.
Calculated totals and detail fields (Office XP only) allow you to enhance data with summarizations and other fields that aren’t available in the original data source. For instance, you might want to determine how a seasonal storewide markdown in prices would affect profitability on specific products, but this type of analysis can’t currently be made in the external data source.
To insert calculated totals and detail fields into the PivotTable Component, on the PivotTable Component’s toolbar, click the Calculated Totals And Fields button. Click the option you want, either to create a calculated total or to create a calculated detail field. Assign the calculated total or calculated field a name and a formula, and then drag the total or field from the PivotTable field list to the PivotTable Component.
Your Turn
In this exercise, you will insert a calculated total representing administrative fees of 1.5 percent to process agents’ claims.
-
In the
Sales.htm file’s PivotTable Component’s toolbar, click the Calculated Totals And Fields button, and then click Create Calculated Total. -
In the Name box, type Administrative Fees.
-
In the list next to the Insert Reference To button, select Sum Of Claim Amount (Total).
-
Click the Insert Reference To button.
-
In the formula that appears, type * 0.015 so that the formula looks like this: [Measures].[Total1] * 0.015.
-
Click Change.
-
Close the Commands And Options window, and compare your results to Figure 6-18.
Tip To format the Administratives Fees field to look like currency, click the Administrative Fees field in the PivotTable Component, click Commands And Options on the PivotTable Component’s toolbar, click the Format tab, and select Currency in the Number list.
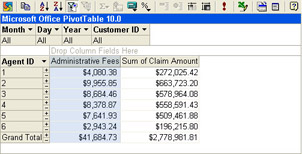
Figure 6-18: Total administrative fees to process insurance claims.
Additional Office XP PivotTable Component Features
The Office XP PivotTable Component has some features that the Office 2000 PivotTable Component does not support, such as custom grouping and custom grouping intervals and enhanced support for percentages as totals. This section briefly describes these features.
Custom Grouping and Custom Grouping Intervals
With custom grouping, you can randomly select items from a row or column field and group them into higher-level groups. For example, in the ![]() Sales.htm file, you can select from an Agent ID row field all of the sales agent IDs that exist in a particular geographic region and create a group. This would add a new row field named Agent ID1 with two members: Group1 and Other. You can change the caption of Group1 to West and Agent ID1 to Region in the Commands And Options dialog box. The Other group will contain all items that you did not include in the new West group. You can then rename the Other group to Other Regions, and the Region field will have two members: West and Other Regions.
Sales.htm file, you can select from an Agent ID row field all of the sales agent IDs that exist in a particular geographic region and create a group. This would add a new row field named Agent ID1 with two members: Group1 and Other. You can change the caption of Group1 to West and Agent ID1 to Region in the Commands And Options dialog box. The Other group will contain all items that you did not include in the new West group. You can then rename the Other group to Other Regions, and the Region field will have two members: West and Other Regions.
To create a custom group, click the label of the parent field that contains the items you want to group, and then click Expand on the PivotTable Component’s toolbar. Click the first item that you want to include in the group. To select more items, hold down the Ctrl key and click each item. Right-click a selected item, and then click Group Items. To remove a custom group from being displayed, right-click the group caption and then click Ungroup Items. To remove a custom group field altogether, right-click the field, and then click Delete.
You can also specify custom grouping intervals, such as to group Agent IDs 1 through 3 together, 4 through 6 together, and so on. To do so, select the row or column field whose items you want to group. On the PivotTable Component’s toolbar, click Commands And Options, and then click the Filter And Group tab. Select an item in the Group Items By list (other than No Grouping). Set Interval to the value you want. To specify the value at which grouping begins, select the Start At check box and then type a value in the accompanying box. To specify the value at which grouping ends, select the End At check box and then type a value in the accompanying box. To remove a custom grouping interval, select No Grouping in the Group Items By list.
Percentages as Totals
Instead of summary totals, you can show totals as percentages. For instance, you can show the percentage that each sales agent contributed to total sales instead of showing the actual dollar amounts. Right-click the total field whose values you want to view as percentages, point to Show As, and then select one of the following options:
-
Click Percent Of Row Total to display the values as a percentage of the total value of each row.
-
Click Percent Of Column Total to display the values as a percentage of the total value of the selected column.
-
Click Percent Of Parent Row Item to display the values as a percentage of the total value of the item’s parent in the row field.
-
Click Percent Of Parent Column Item to display the values as a percentage of the total value of the item’s parent in the column field.
-
Click Percent Of Grand Total to display the values as a percentage of the grand total.
EAN: 2147483647
Pages: 137