Using the Solver Add-In
The Solver Add-In is part of a suite of commands sometimes called what-if analysis tools. With Solver, you can find an optimal value for a formula in one cell—called the target cell—on a worksheet. Solver works with a group of cells that are related, either directly or indirectly, to the formula in the target cell. Solver adjusts values in cells you specify—called the adjustable cells—to produce the result you specify from the target cell formula. You can apply constraints to restrict the values Solver can use in the model, and the constraints can refer to other cells that affect the target cell formula.
You can use Solver to determine the maximum or minimum value of one cell by changing other cells—for example, you can change the amount of your projected advertising budget and see the effect on your projected profit.
To use the Solver add-in:
-
On the Tools menu, click Solver. The Solver Parameters dialog box appears, shown in Figure 3-39.
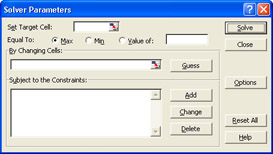
Figure 3-39: The Solver Parameters dialog box.If the Solver command does not appear on the Tools menu, click Add-Ins on the Tools menu, select the Solver Add-in check box, and then click OK. If the Solver check box is not visible, you can follow the directions for installing the Analysis TookPak provided earlier in the chapter. Substitute Solver for the Analysis TookPak, of course.
-
In the Set Target Cell box, type the address for the cell that you want to set to a certain data value or that you want to maximize or minimize. The cell must contain a worksheet formula.
-
Click the Max option if you want to maximize the value; click the Min option if you want to minimize the value. Click the Value Of option if you want a specific value. If you click the Value Of option, type the value in the adjacent box.
-
In the By Changing Cells box, type the address for the cells that can be adjusted until the problem’s conditions are reached and the cell specified in the Set Target Cell box reaches its target. The cells referred to in the By Changing Cells box must be related directly or indirectly to the cell referred to in the Set Target Cell box.
Tip You can click the Guess button to have Excel try to figure out the nonformula cells referred to by the cell in the Set Target Cell box and place their cell addresses in the By Changing Cells box.
-
To add conditions, also known as constraints, click Add for each constraint. To change or delete an existing constraint, click the Change or Delete buttons, respectively.
-
If you add a constraint, the Add Constraint dialog box appears. (See Figure 3-40.) In the Cell Reference box, type the cell address; in the operator list, select an operator (such as <=); and in the Constraint box, type another cell address. Click Add to add another constraint, or click OK to return to the Solver Parameters dialog box.
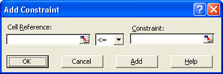
Figure 3-40: The Add Constraint dialog box. -
Click the Options button to display the Solver Options dialog box, which allows you to specify how the Solver add-in solves your problems.
-
Click the Solve button to solve the problem.
Tip You can click the Reset All button to clear the current problem and reset all of the Solver add-in’s settings to their original values.
Your Turn
You want to find out how much extra revenue your hotel would have generated during the past year if your preferred customers had spent an average of $65.00 on room service per night, without increasing the number of nights they booked during the year. You will use the Solver add-in to help make this analysis.
-
Open
 Hotel.xls. If it is already open, close it (do not save it) and open it again.
 -
Calculate the total number of nights booked. To do this, type =SUM(C2:C313) in cell C314 and then press Enter. The total number of nights booked is 3,092.
-
Calculate the amount that all customers spent on room service. In cell D314, type =SUM(D2:D313) and then press Enter. The amount is $147,683.80.
-
Calculate the average room service charge per customer per night booked. To do this, type =D314/C314 in cell E314 and then press Enter. The average spent on room service per customer per night is $47.46.
-
Provide a baseline difference between the current room service charges and the results that the Solver add-in will calculate. To do this, type =D314-147683.80 in cell D315 and then press Enter. The result should be zero for now, as you can see in Figure 3-41.
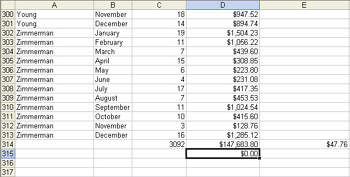
Figure 3-41: The Hotel.xls workbook set up with the information required to run the Solver add-in calculation
Now let’s see what happens when the average amount spent on room service per customer per night is raised to $65.00.
-
On the Tools menu, click Solver.
-
Click the Set Target Cell box, and then click cell E314. The Set Target Cell box should display $E$314.
-
Click Value Of, and then type 65.00 in the adjacent box.
-
Click the By Changing Cells box, and then click cell D314. The By Changing Cells box should display $D$314.
-
Because you don’t want the Solver add-in to change the number of nights that were booked, click Add to add a constraint.
-
Click the Cell Reference box, and then click cell C314. The Cell Reference box should display $C$314.
-
In the adjacent list, select the equals symbol (=).
-
Click the Constraint box, type 3092, and then click OK. The Subject To The Constraints box should display $C$314 = 3092. Compare your result to Figure 3-42.
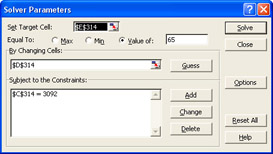
Figure 3-42: The Solver Parameters dialog box with the problem’s cell references and a constraint. -
Click Solve. Cell D315 changes from zero to $53,296.20. If customers had spent an average of $65.00 per night booked during the last year (instead of the amount they actually spent on average—$47.46), the hotel would have collected an additional $53,296.20 in room service revenue.
-
In the Solver Results dialog box, click OK.
EAN: 2147483647
Pages: 137