Sorting Data
Sorting is the easiest data analysis technique to understand because we frequently sort objects. For example, when my wife balances our checkbook every month, she uses a collection of canceled checks along with the bank statement. She usually starts reconciling the bank statement by sorting the checks by check number, from the lowest to the highest. As another example, before I read my e-mail messages, I often sort my unread messages by the date that they were received. I start by reading the message I received first and work through to the message I received most recently. There are, of course, many other examples of sorting: telephone directories that sort by personal or organizational names, grocery stores that sort products by category, hardware stores that sort bolts by size, and so on.
From a business perspective, sorting data allows you to
-
Find one or more records more quickly.
-
In relatively small groups of records, recognize groups of similar records.
Although sorting data can be quick and easy, by itself, sorting data does not allow you to perform data analysis tasks such as
-
Provide overall record counts, overall field totals, minimum and maximum data values for specific fields, and so on. (The data analysis technique used to obtain these results is known as summarization.)
-
Display numeric increases or decreases over time for specific fields in groups of records. (This data analysis technique is known as trending.)
-
Display only those records that answer a specific business question. (This data analysis technique is known as filtering.)
-
Highlight specific data values. (This data analysis technique is known as formatting.)
All the Microsoft data analysis software applications covered in this book allow you to sort data, in some cases with just one or two mouse clicks or keystrokes.
Your Turn
This exercise demonstrates how sorting helps you find data values more quickly.
-
Start Excel, and open the
 CustServ.xls file in the Chap02 folder.
 -
On the worksheet named Original Data, shown in Figure 2-1, locate the smallest number in the column labeled Wait Time (column C).
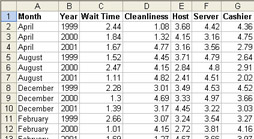
Figure 2-1: The original unsorted data. -
Now click the tab for the worksheet named Sorted by Wait Time, shown in Figure 2-2, and locate the smallest number in the Wait Time column.
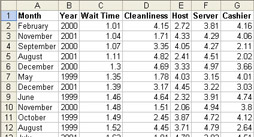
Figure 2-2: Data sorted by the Wait Time field. -
Finding data values is much faster when the values are sorted.
EAN: 2147483647
Pages: 137