documenting site structure
| Once you've made decisions about the structure of your site, you'll need to document your ideas and decisions in a way that others can understand. Several forms of documentation have evolved to help web teams visualize site structure, communicate organizational decisions, and track changes as a site evolves. These visual tools include the site map, the page schematic, and the user path. They're often used together, to represent different aspects of the site structure and user experience. 3 ways to visualize site structure:
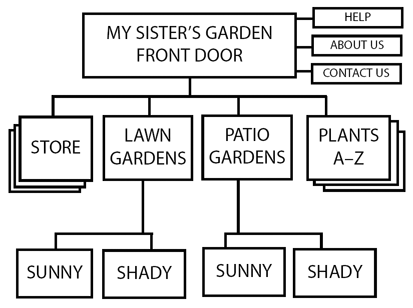
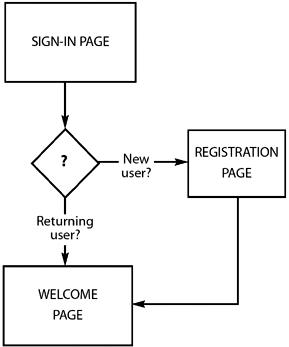
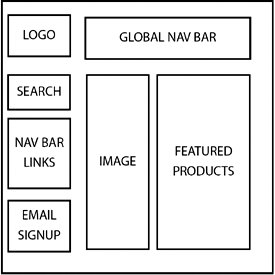
1. the site mapAlso called a flow chart, the site map shows the organization of site sections and how they fit together. Each box represents a page on the site, beginning with the front door. A stack of boxes usually represents a set of pages with the same design and similar content (like those in a searchable database). It may also represent a site section that's described on another map. Each line represents a connection between pages or a path that users may follow. As such, each line or group of lines presents a navigation challenge. The site map is usually created by the information architect or whoever's organizing the site after they've arrived at an organizational structure, but before a navigation system's been designed. 2. the user pathAlso called a user flow or a flow chart, the user path outlines the screen-by-screen experience of the user as they make their way through your site or accomplish a specific task. Each box represents a screen that users see as they move through an experience. Each line represents a path users could follow. The purpose of the user path is to make sure all possible paths are anticipated, including those taken in error. Each diamond represents a decision point. The lines that extend from the diamond represent each possible user path The user path is most important in application- or transaction-based sites, when a user is registering for a service, buying a product, or using a tool on your site. But it can also be helpful to picture and improve the user experience on any site. 3. the page schematicAlso called a wireframe or storyboard, the schematic shows all the elements that will appear on the page, and roughly where they'll appear. Each box represents an element on the page (an image, a nav bar, a headline) without specifying about how it will look. A schematic is usually produced for each type of page or each template on the site before visual design gets underway. However, the level of detail may vary. Some are produced in great detail, showing precise page placement. Others take a rougher cut, showing only the basic elements and suggestions on relative placement. |
EAN: 2147483647
Pages: 195


