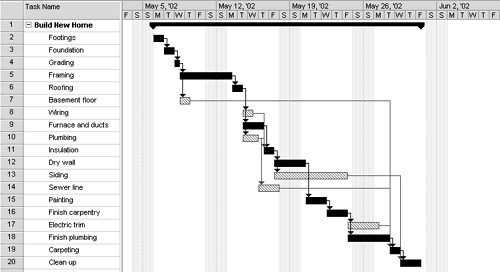
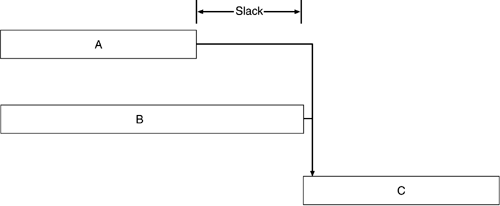
| Referring to the task list, the project manager requests that the team identify the tasks with no predecessors (that is, those ready to be tackled at the project launch meeting.) The project manager asks, "Which task should be entered first?" The owner of this task then reports the length of time that the task will take. The data entry person enters the task name in the Task Name column and, using the computer, lays out a bar horizontally along the row named by this task. It extends the number of days (or weeks) from project launch to task completion. (Using Microsoft Project 2002®, the data entry person enters a number in a duration column beside the task name column and the computer draws the bar.) The duration of time can be discussed by the team. Some project team members may have experience that makes them think the duration is too long or too short. In the end, it is the task leader's call. Giving the task leader the final authority over the task time duration goes a long way toward having the task happen the way it is predicted. It assures each task leader that his or her judgment is respected and that his or her input is important. In the matter of time divisions, hour or month time divisions can be used with project software (rather than days or weeks), but neither is particularly functional for Integrated Project Management. Using hour divisions leads a planner to pretend that each worker will be actively involved every hour of the working day and knows exactly at what hour he or she will work on a task. No one reaches this level of productivity, and few tasks can be realistically estimated in this way. Rather, you should estimate a half-day task duration and a part-time commitment for that half day (2 hours). Sometime during this half day, the task worker will get the task done but not necessarily between 8 and 10 A.M. Using months also is not a precise enough measure. It generally means that the work packages have not been sufficiently broken down into tasks. A task may be estimated to require six or six and a half weeks. This is a useful estimate. (One and a half months is not a precise enough.) The time duration estimated to complete a task is represented by a bar in the Gantt chart. Each task will have a bar. Each bar begins immediately after the task's necessary predecessor is completed. Some tasks have more than one predecessor. These tasks begin when the predecessor extending furthest along the timeline is completed. (All dependencies on prior tasks are shown by connecting lines.) With Microsoft Project 2002® software, the data entry person uses the mouse pointer and indicates a predecessor task name. Then, this person indicates the successor task name while pressing the control (ctrl) key. Next he or she puts the mouse indicator on the "chain" icon on the computer's tool bar and the computer moves the successor task bar to start just after the predecessor ends. Once the time duration is determined, the task leader names the person(s) who will work on the task, the period of time in percentages (working full time on the tasks equals 100 percent) to be spent, and the other necessary resources. This information then is entered on the line following the task bar by the data entry person. With Microsoft Project 2002®, the resources icon on the tool bar is turned on with the mouse pointer and a resource box will display on a corner of the Gantt chart screen. The task then is designated with the mouse pointer, the resource name is entered with the percent commitment on the resource screen, and "assign" is indicated. The name of the resource then appears beside the bar. After the initial task entry, entries will follow on lower lines for each other task that has no predecessor. Some vertical spread (that is, gaps in the task column) can be allowed on the Gantt chart for major task and work package headings or adjustments can be made later. Software procedures are friendly to "Input" and "Delete" and it handles adjustments nicely. When all "no predecessor" tasks are entered, the project manager identifies the initial task with the shortest duration, and requests that the team provide data on tasks that only depend upon this shortest start-up task. These tasks begin the day after their predecessor is completed. Their bars are entered according to the task duration, which the task leader defines. Microsoft Project 2002® software will draw a vertical arrow from the end of the predecessor bar to the beginning of the successor bar to show dependency. This new task bar begins the day after the predecessor ends (see Figure 6-1C). The project manager and team then will move on to the next task and repeat this process until all project tasks are placed on the Gantt chart. The basic principle here is to start each task as soon as its longest running predecessor is finished. As team members report task information, the data entry person enters it into the computer. The project management software package processes this information, and the Gantt chart begins to take shape on the monitor and on the screen in front of the project team. If the data entry person misunderstands any information or makes a mistake, a task leader will notice it on the screen and immediately ask him to correct it. When resource availability causes a time delay, a vertical start line is dropped down from the predecessor and a single horizontal line is extended to the right until the task's start date is reached if Microsoft Project 2002® is the software package being used. The task's bar then will begin at that point. Using this method, a Gantt chart showing hundreds of tasks can be constructed quickly but hundreds of tasks cannot be recorded in two hours. The project manager can estimate what can be accomplished in a two-hour meeting, and he or she can suggest that those task leaders not involved skip the first meeting. They should, however, attend the second meeting, which is scheduled soon after the first. In a few cases, a third meeting may be necessary. It also should be similarly planned. No one should be denied the opportunity to attend any meeting some team leader overlap is desirable at successive meetings. Everyone also should attend the final meeting to review a display of the completed Gantt chart. In addition to showing the project timeline, the Gantt chart displays the resource usage on a task-by-task basis. Following the bar on the task row are the actual name(s) of the person or the occupation of the worker who will perform the task. Because many tasks are completed by a person only working part time, the assigned person's name is followed by a percentage. Non-human resources are similarly represented if the resource is billed by the day or week. If the resource is a one-time charge, such as purchased raw materials, it is represented by the name of the material. Consequently, the Gantt chart not only describes the timeline, but it also spells out, day by day or task by task, the project resource needs. If Microsoft Project 2002® software is used, a "Resources Table" is developed as each resource name is entered on the Gantt chart. The resource screen that takes up a small portion of the Gantt chart screen during the chart's development not only is the mechanism for entering a resource name on the Gantt chart, it also enters this name on a resource table that is not displayed at this time (see Figure 6-1D). This table can be "referred to" by selecting the resource table view from the software's View menu. On this resource table, the project manager can enter the pay rate of each resource (hourly, daily, or monthly, as appropriate). The software prorates costs according to this rate information and the time commitment of the resource person to the task. This also provides information for calculating cost, task by task, as the Gantt chart is being developed. After using the resource task view, a person doing data entry can "turn back" to the Gantt chart view. Once the first draft of the Gantt chart is completed, the critical path is identified (see Figure 6-4). It is the sequence of tasks through the project that follow one after the other, with no break in time. Only the tasks on the critical path must be started as soon as their predecessors are completed (see Chapter 7 for details.) The first draft will reveal "slack" for non-critical path tasks. Slack is the lag time between a task's completion and when its successor can start (see Figure 6-5). Critical path and slack situations are discovered after the completion of the Gantt chart. Assumptions must not be made about them until the first draft of the Gantt chart is completed.
Figure 6-4. 
Figure 6-5. 
Computer Disadvantage Using a computer to create a Gantt chart has many advantages, but there is one disadvantage. The Gantt chart fills up the entire screen, and soon the finished part has to be "scrolled" into memory to make room for new entries. Although it is possible to scroll back the chart for review, it soon becomes impossible to display the entire chart all at once. Hooking a printer (the bigger, the better) to the computer helps to reduce this problem. Periodically and at the end of each two-hour session, the finished portion of the Gantt chart should be printed and copies distributed to the team. When a very large printer is not available and portions of the Gantt chart are printed on 8 1/2 by 11 paper, the pages will have to be pasted together to show the complete Gantt chart. This completed portion of the chart should always be immediately displayed on a large wall. Cutting and pasting is a project skill. Lots of cutting and pasting is necessary with 8 1/2 by 11 printouts. It works best to trim one edge of the page with a paper cutter and tape it at the working edge of the prior page. One must not shrink the scale to reduce the number of pages large scale is necessary to make the task relationships clear. We have previously taped together dozens of pages to display a large project Gantt chart. A wall in a large conference room or hallway works well for this display. Team members can review the Gantt chart on their computers wherever a good Local Area Network (LAN) is available. Entries must always be password protected! They can be viewed, but only the project manager can add information or make changes! (Put the project in a data file and protect it from data entry. Allow "read only" access to the file.) |