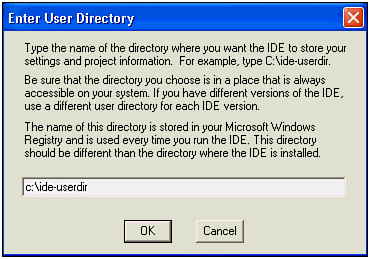
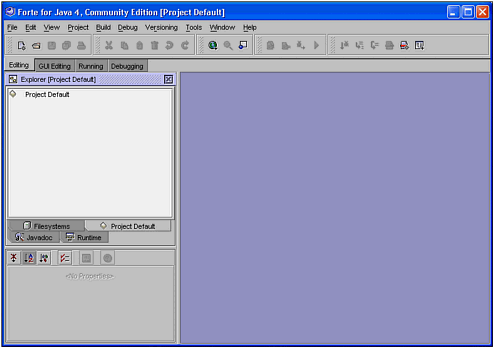
| You can run Sun One Studio by double-clicking the desktop icon that the installation process creates. Alternatively, you can type the following in a command window: C:\>forte_jdk\forte4j\bin\runidew In either case, the first window that you see will request that you specify a directory that Sun One Studio can use to store information about your projects and preferences. Figure B.1 shows this screen: You can use any directory name, but Sun recommends that you not use the installation directory. We used c:\ide-userdir on our test machine. Figure B.1. The IDE stores project information and preferences in the User Directory.  After you specify this directory, you will be led through a series of questions about your preferences and given a chance to register. When you finish, you will see a screen that looks like the one in Figure B.2. Figure B.2. The IDE contains more options than a Swiss Army Knife.  The sheer number of buttons, tabs, and menu choices available in the IDE can be overwhelming. Luckily, you can learn how to use a few of them at time until you learn your way around the IDE. There are two options for running the IDE: single-window, where different panels contain the functionality, and multiple-window mode, where different windows contain a single panel each. We will use the single-window mode in this chapter. The IDE is divided into different logical areas, including Menu Bar Contains menu picks. Tabbed Tool Bar Contains buttons that change depending on the tab selected. The tabs are Editing, GUI Editing, Running, and Debugging. Explorer Panel This is a set of Tabbed Dialogs that provide views of different information in the IDE. The Tabs are Filesystems, Project Default, Javadoc, and Runtime. Whenever you create a new project, it receives its own tab in the Explorer. Output Panel This panel appears whenever the Tool Bar Tab is set to either Running or Debugging. It displays error messages and println statements. Debugger Panel This window shows you current watches, call stacks, and so forth when you are debugging. Editing Panel This window shows you the document that you are currently editing. Normally, you click a file or class name in the Explorer Panel to open that file in an editor.
You will learn how to use each of these panels as we walk through the examples in this chapter. |