Logging Tools
|
| < Day Day Up > |
|
As a developer, you have several good choices for implementing logging in your applications:
-
The Trace and Debug classes
-
The EventLog class
-
The Logging Application Block
-
The Enterprise Instrumentation Framework
-
log4net
With these choices available, it’s unlikely that writing your own logging code is the best bet. Take the time to evaluate these packages before you decide to set off on your own. You’ll probably find that your logging needs have already been anticipated. In this section of the chapter, I’ll review some of the features of these logging packages.
The Trace and Debug Classes
I mentioned the System.Diagnostics namespace, and the Trace and Debug classes that it contains, in Chapter 4, “Coding Defensively.” Now it’s time to look at the Trace class in somewhat more detail, because it provides basic runtime logging functionality. If your needs are simple, you might be able to use the Trace class in your own logging strategy. In this section, I’ll dig into the Trace class in a bit more detail, showing you how to use the TraceListener and TraceSwitch classes to implement a configurable logging strategy.
Mechanics of the Trace Class
So far, you’ve seen the use of the Trace.Assert method during coding. But the Trace class is much more flexible than that. Table 10.1 lists some of the members of the Trace class.
| Member | Type | Description |
|---|---|---|
| Assert | Method | Checks a condition and displays a message if the condition evaluates to False |
| AutoFlush | Property | If set to True, specifies that the Flush method should be called on the Listeners collection after every write |
| Close | Method | Flushes the output buffer and then closes the Listeners collection |
| Fail | Method | Displays an error message |
| Flush | Method | Flushes the output buffer and causes buffered data to be written to the Listeners collection |
| Listeners | Property | Specifies a collection of Listeners that will receive the trace output |
| Write | Method | Writes the given information to the trace listeners in the Listenerscollection |
| WriteIf | Method | Writes the given information to the trace listeners in the Listenerscollection only if a specified condition is True |
| WriteLine | Method | Same as Write, but appends a newline character after the information |
| WriteLineIf | Method | Same as WriteIf, but appends a newline character after the information |
For application logging, the key methods here are the four Write methods, which can be used to write arbitrary information to the members of the Listeners collection. What can go in this collection? Just about anything, as you’ll learn in the next section.
| Note | The Debug class has the same members as the Trace class, and uses the same communications channels. I won’t use the Debug class in this chapter because it’s generally not useful in logging after an application ships, because the debug code is disabled at that time. |
Using Trace Listeners
Trace listeners are classes (derived from the abstract TraceListener class) that can receive messages from the Trace class. The Trace class can have any number of trace listeners in its Listeners collection, and all output from the Trace class (for example, the string sent with a call to Trace.Write) is received by every listener in the collection. The .NET Framework includes three standard implementations of the TraceListener class:
-
DefaultTraceListener A DefaultTraceListener object is automatically added to the Listeners collection of the Trace and Debug classes at startup. Its behavior is to write messages to the Output window.
-
TextWriterTraceListener A TextWriterTraceListener object writes messages to any class that derives from the Stream class. You can use a TextWriterTraceListener object to write messages to the console, to a file, or even to a network connection.
-
EventLogTraceListener An EventLogTraceListener object writes messages to the Windows event log.
You’re also free to create custom trace listeners by creating your own class that inherits from the base TraceListener class. If you create such a class, you are required to implement at least the Write and WriteLine methods.
Controlling Tracing with Switches
To use the Trace class for runtime application logging, you’ll also need to know about trace switches. Trace switches allow you to control the amount and detail of tracking done in a program. These switches are set in an external XML configuration file. Since XML files are plain text, this gives you an easy way to let the user turn on tracing (probably at your instruction). There’s no need to recompile the application. The application will automatically pick up the changes from the configuration file the next time you run the application.
Trace switch classes derive from the abstract Switch class. There are two predefined classes for creating trace switches: the BooleanSwitch class and the TraceSwitch class. Both of these classes derive from the abstract Switch class. You can also define your own trace switch class by deriving a class from the Switch class.
The BooleanSwitch class lets you simply turn tracking on or off. Its default value is 0, which indicates that the Trace class should not produce any output. If you set the value of a BooleanSwitch class to any non-zero value, it turns tracing on.
The TraceSwitch class provides for five levels of tracing. These values are defined in the TraceLevel enumeration, with a default of 0:
-
Off (0): No tracing
-
Error (1): Error messages only
-
Warning (2): Warning and error messages
-
Info (3): Warning, error, and informational messages
-
Verbose (4): All messages including extra detail
The TraceSwitch class has a set of properties that you can check at runtime to determine the specified tracing level, as shown in Table 10.2.
| Property | Description |
|---|---|
| Level | Returns one of the TraceLevel enumeration values to indicate the tracing level that’s currently set |
| TraceError | Returns True if Level is set to Error, Warning, Info, or Verbose; otherwise, returns False |
| TraceInfo | Returns True if Level is set to Info or Verbose; otherwise, returns False |
| TraceVerbose | Returns True if Level is set to Verbose; otherwise, returns False |
| TraceWarning | Returns True if Level is set to Warning, Info, or Verbose; otherwise, returns False |
Logging with the Trace class
Now that you’ve seen all the pieces that provide configurable tracing with the Trace class, let me show you how they fit together. Here’s how I can use the Trace class to add some configurable logging to the DownloadTracker test program. First, I’ve declared a TraceSwitch class at the class level, so it’s available throughout the application:
// Switch to control runtime application logging static TraceSwitch ts = new TraceSwitch("MainLog", "Control application logging"); With the switch declared, I can use its properties to control the rest of the logging logic. For example, here’s some code from the Load event handler for the main form:
private void Form1_Load(object sender, System.EventArgs e) { // Add a listener if the user has requested tracing if(ts.Level>0) { TextWriterTraceListener tl = new TextWriterTraceListener( File.CreateText(Path.Combine( System.Environment.GetFolderPath( Environment.SpecialFolder.ApplicationData), "DTLog.txt"))); Trace.Listeners.Add(tl); } // Write an informational message if(ts.TraceVerbose) Trace.WriteLine("Started DownloadTracker", "DTInformation"); } This code adds a new trace listener to handle logged messages—but only if tracing is actually turned on in the application’s configuration file. Then, if the tracing level is set to Verbose, it writes a message. The second argument to the WriteLine method is an arbitrary category for the event; this is mostly useful if you’re using an EventLogTraceListener.
| Tip | Note the use of the System.Environment.GetFolderPath method to make sure that the code writes the log file to a folder where the user is guaranteed to have the right to create files. |
Whenever something significant happens in the application, it makes another call to the Trace.WriteLine method after checking the trace level:
private void btnGo_Click(object sender, System.EventArgs e) { // Write an informational message if(ts.TraceInfo) Trace.WriteLine("User clicked the Go button", "DTInformation"); // other code omitted // Write a log message if(ts.TraceError) Trace.WriteLine("Downloading " + d.ProductName, "DTAction"); DT.UpdateDownload(d); } The final step is to set up the application configuration file, which is just an XML file named with the application’s name plus the .config extension (for example, DownloadTracker.exe.config). Here are the contents that I’d ship that file with, with a trace level that disables all tracing:
<?xml version="1.0" encoding="utf-8" ?> <configuration> <system.diagnostics> <switches> <add name="MainLog" value="0" /> </switches> </system.diagnostics> </configuration>
If you run the application with this configuration file, you’ll find that it doesn’t even create a log file. However, if you change the value attribute of the add tag, then events will be logged depending on the value that you set. For example, a value of 4 will produce a file similar to this:
DTInformation: Started DownloadTracker DTInformation: User clicked the Go button DTAction: Downloading Newdownload.zip
| Tip | If you add a configuration file named App.config to the root folder of your application, Visual Studio .NET will take care of making a copy with the correct name at runtime. |
The EventLog Class
There’s another logging option in the System.Diagnostics namespace: you can use the EventLog class to write directly to the Windows event logs. This has the advantage that most users already know how to use the Event Log Viewer to look at event log entries. It also puts your logging messages into a repository that’s not likely to be damaged or deleted accidentally.
Keep in mind, though, that there is no event log on Windows 95 or Windows 98, so you’ll need to find a different solution if your target market includes those operating systems.
Table 10.3 shows some of the important members of the EventLog class.
| Member | Type | Description |
|---|---|---|
| Clear | Method | Removes all entries from the specified event log |
| CreateEventSource | Method | Creates a custom event source that you can use to write to an event log |
| Log | Property | The name of the event log to use with this instance of the class |
| MachineName | Property | The name of the computer where the event log is located |
| Source | Property | The event source to use when posting events |
| SourceExists | Method | Checks to see whether a specified event source already exists |
| WriteEntry | Method | Writes a new entry to the event log |
Writing to the event log is easy. Here’s how you might instrument a click event:
private void btnGo_Click(object sender, System.EventArgs e) { EventLog el = new EventLog("Application"); el.Source = "DownloadTracker"; // Write an informational message el.WriteEntry("User clicked the Go button", EventLogEntryType.Information); // other code omitted // Write a log message el.WriteEntry("Downloading " + d.ProductName, EventLogEntryType.Error); DT.UpdateDownload(d); } This code first sets up a reference to the standard Application log, and then uses the WriteLine method to pass messages to the log. Figure 10.1 shows one of these messages in the Event Log Viewer application.
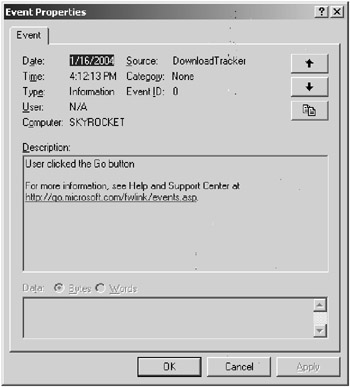
Figure 10.1: An event log message from Download Tracker
If you like, you can create your own custom event log instead of using the standard Application log. This requires only a little more code. First, you need to check whether the log already exists, and create it if it does not. Second, you just use the new log name when writing events:
private void Form1_Load(object sender, System.EventArgs e) { // Create the new event log and the corresponding source if need be if(!EventLog.SourceExists("DownloadTracker")) EventLog.CreateEventSource("DownloadTracker", "DownloadTrackerLog"); // Write an informational message EventLog el = new EventLog(); el.Source = "DownloadTracker"); el.WriteEntry("Started DownloadTracker", EventLogEntryType.Information); } private void btnGo_Click(object sender, System.EventArgs e) { EventLog el = new EventLog(); el.Source = "DownloadTracker"; // Write an informational message el.WriteEntry("User clicked the Go button", EventLogEntryType.Information); // other code omitted // Write a log message el.WriteEntry("Downloading " + d.ProductName, EventLogEntryType.Error); DT.UpdateDownload(d); } One nice thing about the event log methods is that they all take an optional parameter that specifies a computer name whose log should be used. If you’re testing your application on an intranet, this gives you an easy way to consolidate events from many test machines to a single place.
Using an event log to handle your logging also means that you can take advantage of the standard Windows management infrastructure for events. For example, the user can specify a maximum size for the event log, and have newer events overwrite older ones when the log threatens to grow beyond that size. The Event Log Viewer application also supports filtering event logs to make it easier to find particular events.
But the EventLog class doesn’t have the ability to choose at runtime whether or not to write a particular event. If that’s important to you, you’ll need to use the Trace object to check for a trace level, and then call the EventLog.WriteEntry method depending on the current trace level.
| Note | I didn’t want to load up the actual Download Tracker code with a bunch of different logging mechanisms. So unlike the other code in this book, you won’t find most of the code from this chapter in the sample project. |
The Enterprise Instrumentation Framework
The Trace class provides all the basics you need for application logging, but sometimes you’ll need to move beyond the basics. For example, correlating application logs between multiple tiers of a distributed application can be difficult. One way to overcome this difficulty is to use the Enterprise Instrumentation Framework (EIF), a set of classes and utilities that work with the .NET languages to provide monitoring for distributed applications. Microsoft has released the EIF as a free download at www.microsoft.com/downloads/details.aspx?FamilyId=80DF04BC267D-4919-8BB4-1F84B7EB1368&displaylang=en. Although it’s presented as an event-monitoring solution, you’ll see that it’s well suited as the core of a logging strategy. The key features of EIF are
-
A single model for raising and recording tracing and diagnostic events across all parts of a distributed application
-
Windows Management Instrumentation (WMI) compatibility for integration with existing enterprise-monitoring tools
-
A flexible runtime configuration layer that’s designed to be modified by simple scripting code for “on-the-fly” changes to your monitoring configuration
-
Windows Event Tracing, a new service for high-speed kernel-mode tracing that’s capable of recording hundreds or thousands of events in rapid succession
-
Event correlation across distributed applications
| Note | EIF was originally released with Visual Studio .NET 2003, but it will work with the .NET Framework 1.0 as long as you install SP2 for the Framework. |
For the sort of small applications that I’m focusing on in this book, the EIF may be too complex. Nevertheless, it’s worth having an overview of its architecture so that you can have it in mind as you move to more complex development.
The EIF Architecture
Figure 10.2 provides a high-level overview of the EIF architecture.
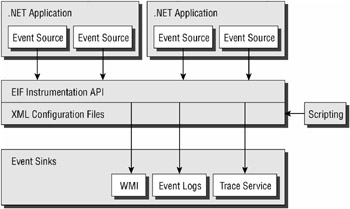
Figure 10.2: EIF architecture
The overall idea of EIF is to define event sources, which post events from any tier of an application, and event sinks, which can receive events. EIF’s own instrumentation API works as a routing layer between sources and sinks, and is controlled by XML configuration files. Those files themselves can be modified by scripting code, creating a convenient way for testers or administrators to manage the details of event logging. If your application begins to fail, for example, you can start capturing detailed information to a Windows event log, a trace log, or a WMI listener, simply by running a configuration script and without recompiling or stopping any tier of your application. Of course, you have to build in the event sources when you create the application. Note that this is an even more powerful way of configuring logging than the Trace class offers, because you can change the logging level on-the-fly while an application is actually failing. The price for this is that you need to deal with a more complex architecture.
Event Sources
When you’re using EIF, an event source is an instance of a particular class. When you hook up EIF to your application (by setting a reference to the Microsoft.EnterpriseInstrumentation namespace, which is available after you install the EIF download), it automatically adds a default event source with the reserved name Application. To raise an event, you call the static Raise method of one of the classes contained in the Microsoft.EnterpriseInformation.Schema namespace. If you don’t specify a source, the default application source is assumed. The Microsoft.EnterpriseInformation.Schema namespace defines a number of event classes, which you can use to indicate different types of events. For example:
TraceMessageEvent.Raise("Tracing message"); AuditMessageEvent.Raise("Recording an audit record"); AdminMessageEvent.Raise("An administrative event"); To define your own event sources, in addition to those built into the EIF, you just create new instances of the EventSource class. For example, you might want to distinguish events raised by a user interface component from events raised by a database component. These user-defined event sources are known as SoftwareElement event sources. In code, it works this way:
class UserInterfaceComponent { public static EventSource es = new EventSource("UI"); // code somewhere in the component public void ConfigurationMethod() { // raise an EIF event TraceMessageEvent.Raise(es, "A message from the UI component"); } } class DatabaseComponent { public static EventSource es = new EventSource("Database"); // code somewhere in the component public void DatabaseMethod() { // raise an EIF event TraceMessageEvent.Raise(es, "A message from the database component"); } }
Event Sinks
The EIF supplies three standard event sinks. You don’t have to write any code to make use of these sinks, beyond the code that raises EIF events:
-
TraceEventSink This sink uses the new Windows Trace Session Manager to write to a trace log. The sink can handle hundreds or thousands of events per second, and uses a custom binary log file format.
-
LogEventSink This sink writes to the Windows Application event log. By default, it writes to the local machine, but you can also specify a computer name (useful for consolidating events to a central location).
-
WMIEventSink This sink uses Windows Management Instrumentation (WMI) for output. It’s the slowest of the three alternatives, and so should be reserved for infrequent or critical events. But it’s also the one that will plug into third-party monitoring frameworks most easily.
You can also define custom event sinks. To do so, you derive a class from the abstract base class EventSink, writing code to send events wherever you like by implementing the Write method. Custom event sinks must be compiled with a strong name and installed into the Global Assembly Cache (GAC). For end-user logging, you’d probably want a custom event sink that simply saves events to a disk file. However, for an application that only runs on a single PC, EIF is probably overkill; for a distributed application, a more central sink such as the TraceEventSink or WmiEventSink is probably a better bet.
| Note | For more alternatives, see the discussion of the Logging Application Block later in this chapter. |
| Note | If you need more information on assigning a strong name to an assembly a good place to start is with the Patterns & Practices chapter “Building Secure Assemblies” (http://msdn.microsoft.com/library/default.asp?url=/library/en-us/dnnetsec/html/THCMCh07.asp). |
Configuring EIF
When you’re using the EIF, your code won’t contain any explicit connections between event sources and event sinks. Instead, a set of XML configuration files controls these connections at runtime. This has the great advantage that you can customize the configuration to save more or fewer events depending on circumstances. In a routine operation, you might not hook up any event sources to event sinks at all; in this case, all of the events are discarded with minimum overhead. To catch infrequent errors, you could connect all of the sources to a TraceEventSink for later analysis. Or, if there’s a critical failure happening on a mission-critical server, you can quickly tie the components from that server into WMI for real-time monitoring.
Most of this plumbing is set up with an individual application’s EnterpriseInformation.config file, which is stored in the same folder as the application’s executable file. Sections in this file include:
-
<instrumentedApp> Contains overall information about the application.
-
<eventSources> Includes definitions of each event source in the application.
-
<eventSinks > Defines the event sinks available to the application.
-
<eventCategories> Contains groups of event types that can be enabled or disabled as a unit.
-
<filters> Includes associations between event sinks and event categories.
-
<filterBindings> Contains associations between event sources and filters.
As you can see, the flexibility of EIF results in a pretty complex configuration file. Fortunately, you can start with the sample configuration files installed with EIF and adapt them to your own applications quickly.
The Logging Application Block
You probably noticed that some of the logging-oriented features of the Trace class are absent from the EIF. For example, there’s no concept of levels of tracing in the EIF, nor is there any way to format events for easy reading. Microsoft addressed these and added some other features in another free download, the Logging Application Block, which is available at www.microsoft.com/downloads/details.aspx?FamilyId=24F61845-E56C-42D6-BBD5-29F0D5CD7F65&displaylang=en.
The Logging Application Block adds several features to the EIF. From the perspective of maintaining an application log, these are the most important:
-
Support for a set of logging levels similar to those that the Trace class defines.
-
A new event sink that accepts events into a Microsoft Message Queue (MSMQ) to provide reliable asynchronous logging. This is useful if part of your application is disconnected from your central event repository at times.
-
A new event sink that accepts events into a SQL Server database.
-
An event transformation engine that can add information to events (for instance, common settings that apply to all events in a class), delete unwanted information, and flexibly format the results using Extensible Stylesheet Language Transformations (XSLT). There’s also an interface that allows you to write your own formatting classes.
Other features are included as well, such as support for tracing and metering within web services, that are less important for application logging.
Of course, if the EIF is complex, the EIF plus the Logging Application Block is even more complex. Still, if you’re faced with a need to maintain correlated logs on the pieces of a distributed application, I recommend implementing the combination rather than using the EIF alone.
log4net
Another alternative directed specifically at logging is the open-source log4net project (based on the existing log4j open-source project from the Java world). log4net provides a wide range of features aimed directly at application logging:
-
Support for the Microsoft .NET Framework 1.0 and 1.1, as well as the .NET Compact Framework, Microsoft’s shared-source implementation (“Rotor”), and the open-source Mono implementation
-
Output to an extremely wide variety of targets:
-
Databases via ActiveX Data Object (ADO)
-
The ASP.NET trace context
-
The console
-
Event logs
-
Disk files, with or without rolling overwrites
-
An in-memory buffer
-
Windows Messenger (net send) service
-
The Debugger
-
A remoting sink
-
E-mail
-
.NET trace listeners
-
UDP datagrams
-
-
Multiple targets for a single log entry
-
Level-based logging to pare events down
-
As many different loggers as you like, arranged in a hierarchy for configuration purposes
-
Dynamic runtime configuration via XML files
-
Static configuration via assembly attributes
-
Filtering on a per-target basis, so a target can decide which events it wants to log
-
Flexible layout and rendering classes
-
A plug-in architecture for easy extension
You can download log4net from http://log4net.sourceforge.net/. Like many open-source projects, it seems to be perpetually in beta; as I write this, you can download a beta build of version 1.2 or a release build of version 1.1.1. Either way, don’t let the beta status scare you; this is a mature product that has been under development in the .NET and Java worlds for quite a while now.
As you might guess from the list of features, quite a bit of complexity is available in log4net. But a simple example should give you the flavor of using log4net. For starters, here’s what a log4net configuration file (by convention, named with the extension .log4net and the name of the application’s executable) might look like for Download Tracker:
<?xml version="1.0" encoding="utf-8" ?> <log4net> <!-- Define the logging target --> <appender name="FileAppender" type="log4net.Appender.FileAppender"> <param name="File" value="DTlog.txt" /> <param name="AppendToFile" value="true" /> </appender> <!-- Set the default logging level and hook up the file --> <root> <level value="DEBUG" /> <appender-ref ref="FileAppender" /> </root> </log4net>
As you can see, the configuration is all contained in XML. Just about everything about log4net can be set in the configuration file. This particular file defines a file to hold the output of logging operations, and sets the default logging to DEBUG, which means that all logging of DEBUG level or higher will be saved to the file.
There are several ways to associate this file (saved as DownloadTracker.exe.log4net) with the actual code being executed, but probably the easiest is to use a .NET attribute. Adding this attribute anywhere in the assembly will do the trick:
[assembly: log4net.Config.DOMConfigurator( ConfigFileExtension="log4net", Watch=true)]
Specifying true for the Watch attribute tells log4net to actively monitor the file, and reload it if it changes. This lets you make on-the-fly changes to things like the logging level, or even the logging target, without restarting the application.
log4net relies on loggers to actually provide the information to be logged. You can have any number of loggers in your application, arranged hierarchically. For example, Download Tracker might have a logger named DownloadTracker and another named DownloadTracker.Database. For simplicity, a small project will probably only use a single logger. This can be defined at the class level as a static object:
private static readonly log4net.ILog log = log4net.LogManager.GetLogger( System.Reflection.MethodBase.GetCurrentMethod().DeclaringType);
Note the use of reflection here to automatically assign a name to the log, based on the enclosing class. Using this code to declare your loggers means you automatically get a logger hierarchy that matches your class hierarchy. Table 10.4 shows the members of the ILog interface.
| Member | Type | Description |
|---|---|---|
| Debug | Method | Logs a message with the DEBUG level |
| Error | Method | Logs a message with the ERROR level |
| Fatal | Method | Logs a message with the FATAL level |
| Info | Method | Logs a message with the INFO level |
| IsDebugEnabled | Property | Returns True if the logger will save DEBUG messages |
| IsErrorEnabled | Property | Returns True if the logger will save ERROR messages |
| IsFatalEnabled | Property | Returns True if the logger will save FATAL messages |
| IsInfoEnabled | Property | Returns True if the logger will save INFO messages |
| IsWarnEnabled | Property | Returns True if the logger will save WARN messages |
| Warn | Method | Logs a message with the WARN level |
With these methods, I can rewrite the example of logging in the btnGo event procedure:
private void btnGo_Click(object sender, System.EventArgs e) { // Write an informational message if(log.IsInfoEnabled) log.Info("User clicked the Go button"); // other code omitted // Write a log message if(log.IsErrorEnabled) log.Errors("Downloading " + d.ProductName); DT.UpdateDownload(d); } Overall, log4net provides an extremely fast and flexible way to log just about anything in a proven, high-performance framework. If you’re willing to incorporate an open-source dependency in your development, it’s an excellent choice.
|
| < Day Day Up > |
|
EAN: 2147483647
Pages: 118
- The Effects of an Enterprise Resource Planning System (ERP) Implementation on Job Characteristics – A Study using the Hackman and Oldham Job Characteristics Model
- Context Management of ERP Processes in Virtual Communities
- Intrinsic and Contextual Data Quality: The Effect of Media and Personal Involvement
- A Hybrid Clustering Technique to Improve Patient Data Quality
- Relevance and Micro-Relevance for the Professional as Determinants of IT-Diffusion and IT-Use in Healthcare