8.6 Using System Logger performance data
|
| < Day Day Up > |
|
8.6 Using System Logger performance data
The following section gives a description of the tools available to collect data regarding System Logger and how to interpret the values.
One of the challenges when tuning System Logger is that there is no online monitor that provides information at the log stream level. While RMF provides some information, it is only at the address space or structure level, not at the log stream level. To get log stream level information, you must post-process the SMF Type 88 records. Methods for doing this will be discussed below.
8.6.1 RMF: Analysis of the CF structure service times
For CF-Structure log streams, the RMF Coupling Facility Activity Report can provide important information about structure usage and service times. However, this report only provides information at the structure level—you must determine the number of log streams associated with the structure in question from either the SMF Type 88 data, or from the log stream definitions.
RMF Coupling Facility Activity Report
In the sample report shown in Figure 8-2, the structure size for LOG_JG2_5M has been altered to 8M, which is 0.4% of the total CF storage. The structure was defined with an INITSIZE of 5M, but altered to 8M due to an excessive number of structure full conditions while running the workload. This structure did 100% of the requests to the CF in the 5 minute interval shown. The average request rate was 5284 per second.
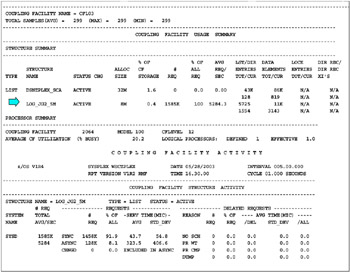
Figure 8-2: RMF Coupling Facility Activity report
System Logger log streams are reported in the LIST section of the Usage Summary part of the report. Under the LST/DIR column there are two lines per structure. The first line gives the total number of entries in the structure, and the second line shows the number currently in use. In the Data Elements column, the first line gives the total number of data elements in the structure, the second line gives the number currently in use. The entries are in a common pool for the structure (the entries for all log streams come from the same pool). Dividing the number of data elements (11K) by the number of entries (5725) gives an entry-to-element ratio of 1:2. The entry-to-element ratio is dictated by the log stream with the largest percentage of records in the structure. If the number of entries in use reaches 90% of the total number of entries available for the structure, System Logger will force an offload of all log streams in the structure.
Notice the current usage (second row of data) indicates a 1:3 ratio (3143 in-use elements/1554 in-use entries), rounded up to the next whole number. As noted above, the number of entries (5725) and elements (11K) in the structure are in a 1:2 ratio. With a MAXBUFSIZE set to 64000, the element size is 256 and consequently, because of the 1:2 ratio, this indicates and expected buffersize of 512 bytes. However, the current usage of 1:3 indicates at least one log stream is writing records of at least 750 bytes.
An important point to remember is the number of data elements is divided equally among the connected log streams. So, if the number of data elements in the structure is 11K, and there are three log streams connected to the structure, each log stream is allocated 3.66K data elements.
The Coupling Facility Activity report also provides information on the request activity for the structure. From the SYSD system, there were 1585K requests, giving an average of 5284 per second. 1458K of the requests were synchronous with average service times of 43.7 microseconds.
The average, or mean, represents the middle in the distribution of a set of individual measurements. The standard deviation measures the spread or variation of the individual measurements on either side of the average, 66% of all observations lie within plus or minus one standard deviation. 95% of all observations lie within plus or minus 2 standard deviations.
The report shows an average SYNC time of 43.7 microseconds with a standard deviation of 54.8 microseconds for the population of SYNC requests. In this case, two standard deviations to the negative side of the average would be less than zero. Consider 0 to +2 standard deviations on the positive side of the average defines the range where 95% of the requests will occur. Therefore, 95% of all SYNC requests for this test would lie between 0 and 153.3 (2*54.8 +43.7) microseconds. If the standard deviation is large (for example in the thousands of microseconds), it indicates some portion of the CF configuration is non-responsive, causing large variability in individual measurements.
The most frequently seen reason for a non-responsive CF is the use of shared CF CPs, especially if Dynamic CF Dispatching (DYNDISP=YES) is enabled for the CF LPAR. Looking at the RMF CF Usage Summary report, whenever the number of logical processors defined is greater than the number of effective logical processors, the configuration may be seeing performance issues. For production CICS regions, if you must use a CF with shared CPs, turning Dynamic CF Dispatching off (DYNDISP=NO) is strongly recommended. The DYNDISP command is entered on the CF console.
Another point of caution—if the CF is actually an LPAR in the same CPC as the z/OS image, and the LPARs share CPs, all SYNC requests will be converted to ASYNC requests. Neither CICS nor the System Logger have control (or knowledge) of the change, and the reports will show the requests as SYNC, but the service times will be elongated.
It's also good to check for delayed requests. For example, if the number of NO SCH (that is, no subchannel), is greater than 10% of the total number of requests for the structure, you should consider adding more CF Link capacity, or reducing the load on the existing links.
Figure 8-3 contains sample JCL to produce the Coupling Facility Activity report.
//CFACT JOB (????,????),'JIM GRAUEL',MSGLEVEL=(1,1), // CLASS=A,MSGCLASS=O,NOTIFY=GRAUEL,REGION=0M /*JOBPARM SYSAFF=SYSD //************************************************** //** FORMAT THE CF ACTIVITY REPORT **** //************************************************** //* PROVIDE THE SMF DATASET NAME * // SET SMFIN1=GRAUEL.PERFTST.R222.RED1R.P1.MAY31.ELEVEN03 //************************************************** //S1 EXEC PGM=ERBRMFPP,REGION=1000K //MFPMSGDS DD SYSOUT=* //SYSPRINT DD SYSOUT=* //MFPINPUT DD DSN=&SMFIN1,DISP=(OLD,KEEP) //SYSIN DD * SYSOUT(O) SYSRPTS(CF) /*COUPLING FACILITY */ //NULL DD *
Figure 8-3: Sample JCL to produce an RMF CF Activity Report
8.6.2 RMF: Workload Activity Reports
(Use: Analysis of RMF data)
RMF provides a wealth of information which is invaluable in the resolution of performance problems. This information can be used to measure the impact of log stream usage and definition changes.
When using z/OS WLM in goal mode, it's possible to define a report class for each CICS region and the System Logger address space. The report classes for regions are in addition to the report classes for transactions as discussed in "DFHLOG and DFHSHUNT example" on page 166.
Each CICS region and System Logger address space should be defined in a separate report class in order to understand the results of each change made during the log stream tuning process.
The same information can be gathered using a Report Performance Group if WLM is being used in compatibility mode. For guidance in defining a compatibility mode Report Performance Group, refer to the section entitled "Defining Service Classes and Performance Goals" in z/SO MVS Planning: Workload Management, SA22-7602.
Figure 8-5 on page 281 contains a WLM Workload Activity Report, which presents data collected for report classes RIYOT1 (a CICS region) and RLOGER (the System Logger address space). Report classes are defined using the WLM ISPF panels.
Sample JCL to produce the Workload Activity report is shown in Figure 8-4 on page 280.
//RCLASS JOB (????,????),'JIM GRAUEL',MSGLEVEL=(1,1), // CLASS=A,MSGCLASS=O,NOTIFY=GRAUEL,REGION=0M /*JOBPARM SYSAFF=SYSD //************************************************** //** FORMAT THE REPORT CLASSES **** //************************************************** //* PROVIDE THE SMF DATASET NAME * // SET SMFIN1=GRAUEL.PERFTST.R222.RED1R.P1.MAY31.ELEVEN03 //************************************************** //RMFPP EXEC PGM=ERBRMFPP,REGION=0M //MFPMSGDS DD SYSOUT=* //SYSPRINT DD SYSOUT=* //MFPINPUT DD DSN=&SMFIN1,DISP=(OLD,KEEP) //SYSIN DD * SYSOUT(O) SYSRPTS(WLMGL(RCLASS(RLOGER))) /* REPORT CLASS FOR THE LOGGER*/ SYSRPTS(WLMGL(RCLASS(RIYOT1))) /* REPORT CLASS FOR IYOT1 */ DINTV(0005) SUMMARY(INT) /*
Figure 8-4: JCL to produce RMF Workload Activity report
The report interval is listed in the START and END times at the top of the report page. A word of caution—the minimum interval is defined by the INTVAL() parm in the SMFPRMxx member of SYS1.PARMLIB. In the samples collected, the interval was set to 5 minutes as follows:
INTVAL(05) /* SMF GLOBAL RECORDING INTERVAL */
It's important to ensure the SMF 70 to 79 records are being collected, along with the CICS 110 records. The records that are to be collected are also defined in the SMFPRMxx member.
SUBSYS(STC,EXITS(IEFACTRT),INTERVAL(SMF,SYNC), TYPE(0,30,70:79,88,89,90,99,110,245)) SUBSYS(OMVS,NOEXITS,INTERVAL(SMF,SYNC), TYPE(0,30,70:79,88,89,90,99,110,245))
When the reports are formatted, it's possible to report a larger interval than was specified in the SMFPRMxx member, by using the DINTV parm for the ERBRMPFF utility. However, the smallest interval which can be reported is the value specified for INTVAL.
The following fields should be noted in the reports:
-
Under TRANSACTIONS:
-
MPL — Multiprogramming level—the number of address spaces active in this service/report class during the interval The value should be one for the most accurate measurements for a given region.
-
-
Under DASD I/O:
-
SSCHRT — Number of start subchannels (SSCH) per second in the reported interval
-
RESP — Average DASD response time (in milliseconds)
-
-
Under SERVICE RATES:
-
TCB — CPU seconds accumulated in TCB mode during the collection interval
-
SRB — CPU seconds accumulated in SRB mode during the collection interval
-
APPL% — Percentage of a engine (CP) used during the collection interval
-
-
Under PAGE-IN RATES:
-
SINGLE — The average rate at which pages are read into central storage
-
-
Under STORAGE:
-
AVG — Average number of central and expanded storage frames allocated to ASIDs in the report class
-
Refer to z/OS V1R4.0 RMF Report Analysis, SC33-7991 for more information about this report.
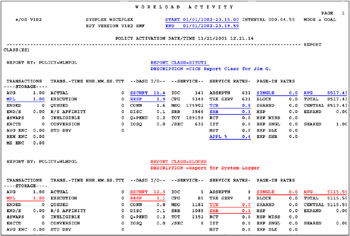
Figure 8-5: Sample Workload Activity report
8.6.3 SMF Type 88 records and IXGRPT1 program
The SMF 88 data fields provide the data to evaluate the operation of log streams managed by the System Logger.
The only generalized interface to System Logger performance information is the SMF Type 88 records produced by System Logger. One SMF Type 88 record is created each interval for each log stream defined in the LOGR policy. IBM provides a sample program in SYS1.SAMPLIB called IXGRPT1 to format the important fields in these records for you. The first step in performing the analysis is to collect the Type 88 records into a data set using JCL similar to that shown in Example 8-3.
Example 8-3: Sample JCL to extract SMF Type 88 records
//SMFDUMP JOB (0,0),'SMF DUMP JOB ',MSGCLASS=X,MSGLEVEL=(1,1), // CLASS=A,NOTIFY=&SYSUID /*JOBPARM SYSAFF=#@$2 //* --------------------------------------------------------- //* THIS JOB WILL COPY THE SMF TYPE 88 RECORDS FROM THE //* SMF DATA SET TO THE DATA SET SPECIFIED ON THE //* DUMPOUT DD STATEMENT //* --------------------------------------------------------- //STEP1 EXEC PGM=IFASMFDP //DUMPIN DD DISP=SHR,DSN=SYS1.#@$2.MAN1 <---------------- //DUMPOUT DD DSN=KYNEF.SMF88.OUT, // DISP=(NEW,CATLG,DELETE), // SPACE=(CYL,(500,50),RLSE),UNIT=SYSDA //SYSPRINT DD SYSOUT=* //SYSIN DD * OUTDD(DUMPOUT,TYPE(88)) INDD(DUMPIN,OPTIONS(DUMP)) //NULL DD *
It is important to understand that System Logger activities can span adjacent intervals. For example, data may be written (SMF88LWB) in the first interval and deleted (SMF88SIB) or offloaded in the second.
When the IXGRPT1 program is used to format the Type 88 records, the timestamp reflects the end of the interval, not the beginning as in other SMF reports.
| Attention: | The timestamps in the reports are given in Greenwich Mean Time (GMT) not local time. |
Each SMF 88 record reports System Logger activity for one log stream or structure. SMF record type 88 has the following subtypes:
Subtype 1 - Reports log stream usage. The records contain the information required for log stream or structure diagnosis and performance analysis.
Subtype 11 - Records CF structure alter activity. Subtype 11 records are produced when the System Logger changes the entry-to-element ratio for CF-Structure log streams.
Note the IXGRPT1 program used to format and report on the SMF Type 88 data does not have the ability to summarize at an interval larger than the interval used for data collection (the INTVAL value specified in the current SMFPRMxx).
SMF 88 subtype 11 records are also recorded if the size of the structure is altered using a SETXCF ALTER command, for example:
SETXCF START,ALTER,STRNM=LOG_JG2_5M,SIZE=10240
An SMF 88 subtype 11 record is written at the completion of the SMF interval, and when the application disconnects from the log stream.
SMF Type 88 records are mapped using the IXGSMF88 macro found in SYS1.MACLIB.
The IXGRPT1 program is supplied as PL/1 source in SYS1.SAMPLIB. In addition, member IXGRPT1J is supplied as self documenting JCL to link-edit and execute a pre-compiled version of the utility, IXGRPT1L which is also supplied in SYS1.SAMPLIB.
The utility reads the SMF Type 88 records from a sequential data set and formats the data by log stream within SMF interval.
Figure 8-6 provides a sample IXGRPT1 output which includes DASD-only and CF-Structure log streams, with the information for the first log stream annotated to show which part of the SMF 88 record each field comes from.
SYSTEM LOGGER ACTIVITY REPORT (IXGRPTRA) BYT WRITTN BYT WRITTN BYT WRITTN AVERAGE BY USERS TO INTERIM TO DASD #WRITES ---#WRITES COMPLETED------ BUFFER --LOGSTREAM NAME------- STRUCTURE NAME-- IXGWRITES STORAGE (INVOKED) INVOKED TYPE1 TYPE2 TYPE3 SIZE BYT DELETD # DELETES BYT DELETD # DELETS ---------------EVENT-------------- INTERIM ST W/O DASD INTERIM ST W/ OFF- DASD STRC NTRY STG ST RE- W/O DASD WRITE W/DASD WRITE LOAD SHFT FULL FULL THLD FULL BLD 01/30/98 0:46:00 AM (SMF INTERVAL TIMESTAMP 'AFEFC71BAFCC7509'X) REESMK.IYK95.DFHJ01 LOG_SYSTEST_006 416 LWB 512 SWB 456 LDB 1 LWI 1 SC1 0 SC2 0 SC3 416C* 0 SIB 0 SII 416 SAB 1 SAI 1EO 1EDS 0ESF 0EFS 0ETT 0ETF 0ERI 01/30/98 0:50:46 AM (SMF INTERVAL TIMESTAMP 'AFEFC82CDD3FC400'X) REESMK.IYK95.DFHSHUNT LOG_GENERAL_008 0 0 0 0 0 0 0 0 0 0 0 0 1 0 0 0 0 0 0 01/30/98 0:50:54 AM (SMF INTERVAL TIMESTAMP 'AFEFC833F7006C07'X) REESMK.IYK95.DFHLOG LOG_GENERAL_005 1112820 1135616 467910 233 230 3 0 4776 631323 172 470196 57 2 1 0 0 0 0 0 01/30/98 0:56:51 AM (SMF INTERVAL TIMESTAMP 'AFEFC988410ADE08'X) REESMK.IYK95.DFHJ01 LOG_SYSTEST_006 416 512 456 1 1 0 0 416 0 0 416 1 1 0 0 0 0 0 0 01/30/98 1:13:54 AM (SMF INTERVAL TIMESTAMP 'AFEFCD58369C4A09'X) REESMK.IYK95.DFHSHUNT LOG_GENERAL_008 0 0 0 0 0 0 0 0 0 0 0 0 1 0 0 0 0 0 0 01/30/98 1:14:00 AM (SMF INTERVAL TIMESTAMP 'AFEFCD5DDE02CD07'X) REESMK.IYK95.DFHLOG LOG_GENERAL_005 3100472 3123200 1182400 207 193 13 1 14978 1875985 145 1145356 60 3 3 0 0 0 0 0 05/11/98 2:21:00 PM (SMF INTERVAL TIMESTAMP 'B06F79A6457A6303'X) IYCUZC07.DFHLOG *DASDONLY* 19444326 28229632 16380778 3894 0 0 0 4993 4694016 635 23736320 3318 90 3 0 0 391 1 0 IYCUZC07.DFHSHUNT *DASDONLY* 350683 1486848 0 363 0 0 0 966 0 0 0 0 0 0 0 0 0 0 0
Figure 8-6: Sample IXGRPT1 output
Notice the timestamp—this is related to the SMF interval, but unlike most other reports based on SMF data, the timestamp reflects the end of the interval not the start.
You notice the report layout takes some getting used to. Each "line" of the report is actually two lines long. Similarly, the column headings are two lines long. For example, taking the right-most column in the report, the heading says "AVERAGE BUFFER SIZE ------- RE- BLD". This means in the right-most column, the "first" line (the one which contains the log stream name) contains the average buffer size for this log stream, and the "second" line contains the number of times the structure was rebuilt. Although this is a bit confusing at first, you will soon get used to it.
8.6.4 IXGRPT1 Field Summary and IXGSMF88 Cross Reference
The following information is intended to provide simple definitions for the report fields and cross reference the report columns to the actual SMF Type 88 data fields. Remember this report only represents information for one system. If you have a log stream which has connectors on multiple systems (forward recovery log, for example), you must view the reports from all systems to get the total view of the activity against the log stream.
The SMF Type 88 fields that are used in the IXGRPT1 report, and the meaning of those fields are as follows:
| LWB | Bytes written by IXGWRITE commands. |
| SWB | Bytes written to interim storage - includes control info. |
| LDB | Bytes written to offload data sets - includes control info. |
| LWI | Number of IXGWRITE commands. |
| SC1/2/3 | Number of IXGWRITEs of each category. |
| C* | Calculated field, not included in SMF record. |
| SIB | Bytes deleted by IXGDELET where record was still in interim storage. |
| SII | Number of blocks deleted by IXGDELET. |
| SAB | Number of bytes deleted because data was offloaded to DASD. |
| SAI | Number of blocks deleted after the data had been offloaded to DASD. |
| EO | Number of offloads. |
| EDS | Number of DASD shifts. |
| ESF | Number of times IXGWRITE got "structure full". |
| EFS | Number of times offload was done because 90% of total structures list entries were in use. |
| ETT | Number of times staging data set hit threshold. |
| ETF | Number of times staging data set filled up. |
| ERI | Number of structure rebuild events initiated. |
A more comprehensive description of each field is as follows:
-
Logstream name (SMF88LSN)
-
Log Stream Name
-
-
Structure Name (SMF88STN)
-
Name of the structure used for this log stream. For a DASD-only log stream, this field will show *DASDONLY*.
-
-
BYT Written by users IXGWRITES (SMF88LWB)
-
This is the total number of bytes passed to System Logger on IXGWRITE requests over the SMF interval. It does not contain any "hot air" [2] assumptions or rounding to the interim storage medium's storage boundary.
The computation is the same for Coupling Facility log streams and DASD-only log streams.
-
-
BYT Written to interim storage (SMF88SWB)
-
The amount of storage used in the "interim" storage portion of the log stream.
This is the total number of bytes passed to System Logger on IXGWRITE requests (from SMF88LWB), plus the "hot air" used to fill out the storage medium increments. It helps to reveal the amount of "hot air" space in the interim storage medium.
For CF log streams, this value includes the amount of element space, rounded up to the element boundary, (either 256 or 512 byte) for each IXGWRITE. For CF log streams that are duplexed to staging data sets, this field still represents the amount of space in the CF that is used—space usage for the staging data sets is not reported in this case.
For DASD-only log streams, this value includes the amount of staging data set CI space (rounded up to the CI boundary (4096 bytes) for each IXGWRITE) required to hold the log data written to the log stream, plus System Logger's staging data set block management control information.
A point of interest - if the same data were written to a DASD-only log stream and a CF-Structure log stream, SMF88SWB will normally be larger for the DASD-only because of the larger storage increments for DASD-only log streams (4096 bytes versus 256 or 512 byes).
-
-
BYT Written to DASD (SMF88LDB)
-
The number of bytes written to the offload data set(s). This includes System Logger control information (40 bytes per log block, at the time of writing). This data is not rounded to a CI boundary—in other words, while each staging data set CI only contains one log block, an offload data set CI can potentially contain a number of log blocks.
-
-
# Writes invoked (SMF88LWI)
-
The number of IXGWRITEs issued by the connectors on this system.
-
-
# Writes Completed
-
TYPE1 (SMF88SC1)
-
The number of IXGWRITEs which completed normally while the log stream had not yet reached its HIGHOFFLOAD threshold and less than 90% of elements were in use. Prior to APAR OA03055, this field is only used for CF-Structure log streams. With the application of OA03055, this field will also contain data for DASD-only log streams.
-
-
TYPE2 (SMF88SC2)
-
The number of IXGWRITEs that completed when the log stream was at or above the HIGHOFFLOAD threshold value, but less than 90% of elements for the log stream were in use. Prior to APAR OA03055, this field is only completed for CF-Structure log streams. With the application of OA03055, this field will also contain information for DASD-only log streams.
-
-
TYPE3 (SMF88SC3) - applies only to CF-Structure log streams.
-
The number of writes completed when 90% or more of elements for the log stream are in use. This field is not applicable to DASD-only log streams.
This field should be zero for best performance.
-
-
-
Average Buffer size
-
Average amount of data passed on each IXGWRITE request during the interval.
This information is not included in the SMF record, it is calculated by the IXGPRT1 program by dividing SMF88LWB by SMF88LWI.
-
-
BYT Deleted interim ST w/o DASD (SMF88SIB)
-
This is the number of bytes deleted from the interim storage, including the "hot air", as a result of IXGDELET requests, where the data had not already been moved to an offload data set. For active log streams, this value should be close to SMF88SWB, meaning most data is being deleted before incurring the overhead of being moved to offload data sets.
For CF-Structure log streams, this value includes the amount of element space, rounded up to the element boundary for each IXGWRITE. The data is deleted from the CF structure without moving the data to an offload data set.
For DASD-only log streams, this value includes the amount of staging data set space rounded up to the CI boundary for each IXGWRITE. The data is deleted from the log stream staging data set without moving the data to an offload data set.
A non-zero value in this field indicates that IXGDELETs are being issued by the log stream connector.
-
-
# Deletes w/o DASD write (SMF88SII)
-
The number of times a deletion from storage was performed where the data had not been moved to an offload data set.
This is another indication that IXGDELETs are being issued for this log stream.
-
-
BYT Deleted interim ST w/DASD (SMF88SAB)
-
During the offload process, System Logger first physically deletes any logically deleted log blocks. If this is not sufficient to reduce the log stream to the LOWOFFLOAD value, it then moves log blocks, starting with the oldest one, to offload data sets until the LOWOFFLOAD threshold is reached.
This field contains the number of bytes which were deleted from interim storage during this interval after the data had been moved to offload data sets.
For CF-Structure log streams, this value includes the amount of "hot air" in each element.
For DASD-only log streams, this value includes the amount of "hot air" in the staging data set CIs. It is worth noting that System Logger does not read the staging data set when moving log blocks to the offload data set—it reads the local buffer (dataspace) copy and writes it to the offload data set. However, the SMF88SAB value represents the amount of space used in the staging data set since this resource is of limited size.
For both CF-Structure and DASD-only active log streams which do tail trimming with the expectation the data will be held within interim storage, this field should be zero for best performance.
-
-
# Deletes w/write (SMF88SAI)
-
The number of times a deletion from storage was performed where the data had been moved to an offload data set. This is not affected by the RETPD specification: in this case data is offloaded, and then deleted.
For an active log stream, this is another reflection that IXGDELETs are not being issued frequently enough. For optimum performance this field should be zero.
-
-
EVENT
-
OFFLOAD (SMF88EO)
-
The number of offload processes which ran in the interval—note that this does not necessarily mean that any data was moved to the offload data sets.
-
-
DASD SHFT (SMF88EDS)
-
The number of times an additional offload data set had to be allocated during the interval.
Monitor this field to see if the number of offload data sets being allocated is consistent with your requirements for this log stream. For critical log streams, this field should be zero or a low number during the prime processing period for best performance and availability.
-
-
STRC FULL (SMF88ESF) (CF-Structure log streams only)
-
Number of times a structure-full condition was reached.
Following the application of OA03055, the System Logger increments SMF88ESF when a log stream exceeds its allowable limit in the structure. The structure may not actually be completely full.
Prior to APAR OA03055, SMF88ESF only reflects the number of times the structure was completely full rather than being log stream-based. The change provides a better correlation of SMF88ESF and Return Code 8 Reason Code 866 errors.
This field should be zero for best performance and availability.
-
-
NTRY FULL (SMF88EFS) (CF-Structure log streams only)
-
Number of times an offload was initiated because the number of entries in use in the structure reached 90%. Note when this condition occurs, an offload is initiated for all log streams in the structure.
This field should be zero for best performance.
-
-
STG THLD (SMF88ETT)
-
Number of times an IXGWRITE was issued and the staging data set had reached or exceeded its HIGHOFFLOAD threshold.
For a CF-Structure log stream, this value should be zero. If the value is greater than zero, it indicates the offload is being triggered because the staging data set hit its HIGHOFFLOAD threshold before the interim storage in the CF.—the size of the staging data set should be increased so it has the capacity to hold the same or a greater amount of data compared to the CF-Structure log stream storage.
For a DASD-only log stream, the value should be equal to or slightly higher than the number of offloads in the interval. A number greater than the number of offloads in the interval indicates a number of IXGWRITE calls were issued to the log stream while it was at or above the HIGHOFFLOAD threshold. A very large number indicates a possible slow down in the offload process.
-
-
STG FULL (SMF88ETF)
-
The number of times the staging data set filled in the interval. This field applies to both CF-Structure and DASD-only log streams.
This field should be zero for best performance and availability. A non-zero value in this field commonly indicates one of the following:
-
There is a problem with the offload process, meaning the System Logger couldn't move the data to the offload data set quickly enough.
-
The staging data is too small for the volume of data being written to this log stream
-
The HIGHOFFLOAD threshold is too high, meaning the space between HIGHOFFLOAD and the data set being full is too small.
-
-
-
RE-BLD (SMF88ERI) (CF-Structure log streams only)
-
The number of times during the interval the structure was rebuilt.
-
-
8.6.5 DFSORT jobs to format SMF 88 records
One of the disadvantages of the IXGRPT1 program is that it tries to squeeze so much information into 133 columns, resulting in its two-lines-per record format, making it difficult to read. Another disadvantage is that it process the SMF 88 records by time rather than by log stream. So, you are given data for every log stream in one interval, then every log stream in the next interval, and so on. If you are trying to quickly review the activity for just one log stream, this can make it cumbersome.
Because of the format of some of the fields in the SMF record, it is necessary to use a DFSORT E15 exit to convert the data. The load module containing the exit, together with sample JCL to produce these reports are available as Additional Material for this redbook. For more information about this, refer to "Locating the Web material" on page 301. Sample of the report obtained through the exit are shown below.
The DFSORT job we used to solve these concerns, breaks the information contained in the IXGRPT1 report across three separate reports. Each report lists the information in log stream name, rather than time, sequence. This makes it easier to review the activity for a given log stream across the entire day.
The reports are broken down as follows:
-
The first report, produced in step SHOWALL, simply lists every log stream for which Type 88 records were found, sorted by log stream name within system. It also lists how many Type 88 records were found for that log stream from that system. Figure 8-7 on page 288 contains an excerpt from that report.

Logstream Names by System 10/15/03 22:23:18 - 1 - System ID Logstream Name Structure Name Records KB Written --------- -------------------------- ---------------- ---------------- ---------- ACPU PROD.DBSF.DFHLOG PROD_A002_LOG 98 46 ACPU PROD.DBSF.DFHSHUNT PROD_A002_SHUNT 98 0 ACPU SYST.ALLE.DFHJ04 SYST_ALLE_J04 40 1383 ACPU SYST.CSWBSTAT SYST_CSWBSTAT 51 487 ACPU SYST.DBAK.DFHLOG SYST_ALLE_LOG 71 37 ACPU SYST.DBAK.DFHSHUNT SYST_ALLE_SHUNT 71 0 ACPU SYST.DBAN.DFHLOG SYST_ALLE_LOG 71 363 ACPU SYST.DBAN.DFHSHUNT SYST_ALLE_SHUNT 71 0 ACPU SYST.DBAS.DFHLOG SYST_ALLE_LOG 79 1072 ACPU SYST.DBAS.DFHSHUNT SYST_ALLE_SHUNT 79 0 ACPU SYST.DBAU.DFHLOG SYST_ALLE_LOG 71 32 ACPU SYST.DBAU.DFHSHUNT SYST_ALLE_SHUNT 71 0 ACPU SYST.DBKA.DFHLOG SYST_ALLE_LOG 72 688 ACPU SYST.DBKA.DFHSHUNT SYST_ALLE_SHUNT 72 0 ACPU SYST.DBKB.DFHLOG SYST_ALLE_LOG 71 7902 ACPU SYST.DBKB.DFHSHUNT SYST_ALLE_SHUNT 71 0
Figure 8-7: Sample report from step SHOWALL -
The next report, produced by step SHOWDEF1, contains information about the selected log stream(s) from a log stream perspective.
A sample of this report is shown in Figure 8-8 on page 289. You will see that the column headings are the suffixes of the SMF 88 fields that the data comes from. For example, the first column after the time and date is the number of IXGWRITEs issued for the log stream in that interval (from SMF88LWI). The next two columns are the minimum (SMF88LIB) and maximum length (SMF88LAB) of the blocks passed on the IXGWRITEs. And so on. As you can see, all the fields in this report are reporting information about the usage of this log stream.
LOGGER 88 LOGSTREAM SECTION 10/12/03 20:12:06 - 1 - LOGSTREAM NAME PROD.DBAP.DFHLOG DATE TIME LWI/# LIB/# LAB/# LWB/KB LDB/KB LIO/# LIS/# ----------- ----- -------------- ------------- -------------- -------------- -------------- -------------- ------------- 2003/06/30 00:00 0 120 7648 0 0 0 0 2003/06/30 00:17 3 120 7648 10 0 1 0 2003/06/30 01:30 4 120 443 1 0 0 0 2003/06/30 02:00 0 120 443 0 0 0 0 2003/06/30 02:30 1 120 443 0 0 0 0 2003/06/30 03:00 0 120 443 0 0 0 0 2003/06/30 03:30 0 120 443 0 0 0 0 2003/06/30 04:00 0 120 443 0 0 0 0 2003/06/30 04:30 0 120 443 0 0 0 0 2003/06/30 05:00 0 120 443 0 0 0 0 2003/06/30 05:30 2 120 4043 4 0 0 0 2003/06/30 06:00 0 120 4043 0 0 0 0 2003/06/30 06:30 0 120 4043 0 0 0 0 2003/06/30 07:00 0 120 4043 0 0 0 0 2003/06/30 07:30 6 120 7648 22 0 0 0 2003/06/30 08:00 16 120 7648 60 0 0 0 2003/06/30 08:30 20 120 7648 76 0 0 0 2003/06/30 09:00 90 120 7648 335 0 0 0 2003/06/30 09:30 98 120 7648 359 0 0 0 2003/06/30 10:00 92 120 7648 343 0 0 0 2003/06/30 10:30 62 120 7648 229 0 0 0 2003/06/30 11:00 70 120 7648 259 0 0 0 2003/06/30 11:30 74 120 7648 274 0 0 0 2003/06/30 12:00 56 120 7648 206 0 0 0 2003/06/30 12:30 24 120 7648 91 0 0 0 2003/06/30 13:00 40 120 7648 145 0 0 0
Figure 8-8: Sample log stream attribute report from step SHOWDEF1 -
The next report, also produced by step SHOWDEF1, contains information about the log stream from an events perspective.
A sample of this report is shown in Figure 8-9 on page 290. While this report may appear very boring (nearly all the fields are zero), in this case, boring is good! A value of zero in most of these fields is an indicator of no problems (for example, no occurrences of DASD shifts (EDS), no occurrences of the staging data set hitting its threshold (ETT), and so on). In this particular report, the one thing that should attract your attention is that there were so few (only 2) offloads (EO) initiated during the entire 16-hour interval. This is an indicator that the interim storage for this log stream is significantly larger than necessary.
LOGGER 88 EVENTS SECTION 10/12/03 20:12:07 - 1 - LOGSTREAM NAME PROD.DBAP.DFHLOG DATE TIME EDS/# ERI/# ERC/# ESF/# ETT/# ETF/# E0/# EFS/# ED0/# ---------- ----- ----------- ----------- ----------- ----------- ----------- ----------- ----------- ----------- ----------- 2003/06/30 00:00 0 0 0 0 0 0 0 0 0 2003/06/30 00:17 0 0 0 0 0 0 1 0 0 2003/06/30 01:30 0 0 0 0 0 0 0 0 0 2003/06/30 02:00 0 0 0 0 0 0 0 0 0 2003/06/30 02:30 0 0 0 0 0 0 0 0 0 2003/06/30 03:00 0 0 0 0 0 0 0 0 0 2003/06/30 03:30 0 0 0 0 0 0 0 0 0 2003/06/30 04:00 0 0 0 0 0 0 0 0 0 2003/06/30 04:30 0 0 0 0 0 0 0 0 0 2003/06/30 05:00 0 0 0 0 0 0 0 0 0 2003/06/30 05:30 0 0 0 0 0 0 0 0 0 2003/06/30 06:00 0 0 0 0 0 0 0 0 0 2003/06/30 06:30 0 0 0 0 0 0 0 0 0 2003/06/30 07:00 0 0 0 0 0 0 0 0 0 2003/06/30 07:30 0 0 0 0 0 0 0 0 0 2003/06/30 08:00 0 0 0 0 0 0 0 0 0 2003/06/30 08:30 0 0 0 0 0 0 0 0 0 2003/06/30 09:00 0 0 0 0 0 0 0 0 0 2003/06/30 09:30 0 0 0 0 0 0 0 0 0 2003/06/30 10:00 0 0 0 0 0 0 0 0 0 2003/06/30 10:30 0 0 0 0 0 0 0 0 0 2003/06/30 11:00 0 0 0 0 0 0 0 0 0 2003/06/30 11:30 0 0 0 0 0 0 0 0 0 2003/06/30 12:00 0 0 0 0 0 0 0 0 0 2003/06/30 12:30 0 0 0 0 0 0 0 0 0 2003/06/30 13:00 0 0 0 0 0 0 1 0 0 2003/06/30 13:30 0 0 0 0 0 0 0 0 0 2003/06/30 14:00 0 0 0 0 0 0 0 0 0 2003/06/30 14:30 0 0 0 0 0 0 0 0 0 2003/06/30 15:00 0 0 0 0 0 0 0 0 0 2003/06/30 15:30 0 0 0 0 0 0 0 0 0 2003/06/30 16:00 0 0 0 0 0 0 0 0 0
Figure 8-9: Sample events report from step SHOWDEF1 -
The third report produced by step SHOWDEF1, contains information about the log stream from the interim storage perspective.
A sample of this report is shown in Figure 8-11 on page 292. Amongst the interesting information this report provides is the amount of log data (in KB) written to interim storage for this log stream (SWB/KB), and the SC1, SC2, and SC3 fields which indicate the number of writes when interim storage was below the HIGHOFFLOAD threshold, over the threshold but below 90% full, and above 90% full.
LOGGER 88 STRUCTURE SECTION 10/12/03 20:12:07 - 1 - LOGSTREAM NAME PROD.DBAP.DFHLOG DATE TIME SWB/KB SIB/KB SAB/KB SSI/# SAI/# SC1/# SC2/# SC3/# ---------- ----- -------- -------- -------- ----------- ----------- ----------- ----------- ----------- 2003/06/30 00:00 0 0 0 0 0 0 0 0 2003/06/30 00:17 11 74 0 25 0 3 0 0 2003/06/30 01:30 1 0 0 0 0 4 0 0 2003/06/30 02:00 0 0 0 0 0 0 0 0 2003/06/30 02:30 0 0 0 0 0 1 0 0 2003/06/30 03:00 0 0 0 0 0 0 0 0 2003/06/30 03:30 0 0 0 0 0 0 0 0 2003/06/30 04:00 0 0 0 0 0 0 0 0 2003/06/30 04:30 0 0 0 0 0 0 0 0 2003/06/30 05:00 0 0 0 0 0 0 0 0 2003/06/30 05:30 4 0 0 0 0 2 0 0 2003/06/30 06:00 0 0 0 0 0 0 0 0 2003/06/30 06:30 0 0 0 0 0 0 0 0 2003/06/30 07:00 0 0 0 0 0 0 0 0 2003/06/30 07:30 23 0 0 0 0 6 0 0 2003/06/30 08:00 62 0 0 0 0 16 0 0 2003/06/30 08:30 77 0 0 0 0 20 0 0 2003/06/30 09:00 341 0 0 0 0 90 0 0 2003/06/30 09:30 365 0 0 0 0 98 0 0 2003/06/30 10:00 349 0 0 0 0 92 0 0 2003/06/30 10:30 233 0 0 0 0 62 0 0 2003/06/30 11:00 264 0 0 0 0 70 0 0 2003/06/30 11:30 280 0 0 0 0 74 0 0 2003/06/30 12:00 210 0 0 0 0 56 0 0 2003/06/30 12:30 93 0 0 0 0 24 0 0 2003/06/30 13:00 148 2029 0 550 0 38 2 0 2003/06/30 13:30 108 0 0 0 0 28 0 0 2003/06/30 14:00 140 0 0 0 0 38 0 0 2003/06/30 14:30 155 0 0 0 0 42 0 0 2003/06/30 15:00 217 0 0 0 0 56 0 0 2003/06/30 15:30 217 0 0 0 0 58 0 0 2003/06/30 16:00 140 0 0 0 0 38 0 0
Figure 8-10: Sample interim storage report from step SHOWDEF1 -
The last report produced by step SHOWDEF1 pulls the information you are most likely to want to monitor together into a single report. A sample is shown in Figure 8-11 on page 292. In this case, the columns headings are actually self-explanatory! This is a good report to use to get a feel for the activity of your critical log streams over the day.
Logger 88 Key Indicators 10/12/03 20:12:07 - 1 - LOGSTREAM NAME PROD.DBAP.DFHLOG Date Time KB Deleted Interim ST W/DASD DASD SHIFT KB Written to Interim Storage KB Deleted interim ST w/o DASD KB Written by Users IXGWRITES STG THLD ---------- ----- ---------------------------- ----------- ----------------------------- ------------------------------ ----------------------------- ----------- 2003/06/30 00:00 0 0 0 0 0 0 2003/06/30 00:17 0 0 11 74 10 0 2003/06/30 01:30 0 0 1 0 1 0 2003/06/30 02:00 0 0 0 0 0 0 2003/06/30 02:30 0 0 0 0 0 0 2003/06/30 03:00 0 0 0 0 0 0 2003/06/30 03:30 0 0 0 0 0 0 2003/06/30 04:00 0 0 0 0 0 0 2003/06/30 04:30 0 0 0 0 0 0 2003/06/30 05:00 0 0 0 0 0 0 2003/06/30 05:30 0 0 4 0 4 0 2003/06/30 06:00 0 0 0 0 0 0 2003/06/30 06:30 0 0 0 0 0 0 2003/06/30 07:00 0 0 0 0 0 0 2003/06/30 07:30 0 0 23 0 22 0 2003/06/30 08:00 0 0 62 0 60 0 2003/06/30 08:30 0 0 77 0 76 0 2003/06/30 09:00 0 0 341 0 335 0 2003/06/30 09:30 0 0 365 0 359 0 2003/06/30 10:00 0 0 349 0 343 0 2003/06/30 10:30 0 0 233 0 229 0 2003/06/30 11:00 0 0 264 0 259 0 2003/06/30 11:30 0 0 280 0 274 0 2003/06/30 12:00 0 0 210 0 206 0 2003/06/30 12:30 0 0 93 0 91 0 2003/06/30 13:00 0 0 148 2029 145 0 2003/06/30 13:30 0 0 108 0 106 0 2003/06/30 14:00 0 0 140 0 137 0 2003/06/30 14:30 0 0 155 0 152 0 2003/06/30 15:00 0 0 217 0 213 0 2003/06/30 15:30 0 0 217 0 213 0 2003/06/30 16:00 0 0 140 0 137 0
Figure 8-11: Sample key indicator report from step SHOWDEF1
8.6.6 Sample spreadsheet to analyze SMF 88 records
Finally, to help you identify log streams that warrant attention with minimal effort, we have developed a simple spreadsheet. The spreadsheet applies some simple checks to your SMF 88 data, checking for signs of log streams that may be poorly tuned. Any field that does not meet the guideline is highlighted in red, for a situation that should be addressed, or orange, for a situation that should be monitored. It will not give you the best-tuned System Logger setup in the world, but it should help you avoid the more common pitfalls.
The spreadsheet, together with instructions on its use, is included in the Additional Material for this redbook. For more information about this, see "Using the Web material" on page 301.
[2]"Hot air" is the difference between the increments of space in the interim storage (for example, 4096 byte CIs in the staging data sets) and the amount of data passed on the IXGWRITE request. For example, if 1096 bytes of data were passed on IXGWRITE for a DASD-only log stream, the "hot air", or empty space, would be 3000 bytes.
|
| < Day Day Up > |
|