Appendix C
A Primer on Representational Analysis and Information Activity Maps
In an information activity map, people, computational technologies, and information- storage media, such as paper forms and computer diskettes, are represented as nodes. Specifically, each node in an information activity map is either: (a) a medium that can contain information, such as paper; (b) a technology; or (c) a person. Arrows depict the movement of information between nodes and are labeled with the information's content as well as the channel used to convey the content. For example, Figure 1-42 depicts a simple information activity map where one person (Fred) says, 'happy birthday' to another person (Wilma) who responds with, 'thank you'. The prefix 'a:' in front of both messages denotes the audio channel.
Common channels abbreviations include 'a' to denote information communicated verbally (audio channel), 'v' to denote information communicated visually (visual channel), and 'k' to denote the use of a keyboard and mouse to enter information into a computer (keyboard channel). It is the explicit representation of the channels that agents use to propagate information that distinguishes information activity maps from other kinds of information maps like physical data flow diagrams (Demarco, 1979).
As Figure 1-42 shows, one can create an information activity map with very simple graphical elements: (a) labels as nodes; (b) arrows between labels; and (c) labels along arrows to represent channels and information. Thus, any drawing program that has labels and arrows can be used to create an information activity map. However, creating an uncluttered diagram typically requires a fair amount of label shifting. For this reason, it is preferable that one use a drawing program that can both automatically connect objects as well as maintain the connections as the objects move. The diagrams in this chapter were created with Microsoft PowerPoint since it has such an 'auto-connector' feature.
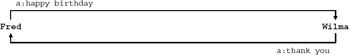
Figure 1-42: An information activity map
Figure 1-43 depicts a more complex information map in which the two people exchange messages remotely: sending messages to their computers using a keyboard as a channel (k: happy birthday, k: thank you); their computers relaying the messages via the internet (i: happy birthday, i: thank you); and the individuals viewing these messages on their respective computer screens (v: happy birthday, v: thank you).
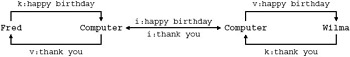
Figure 1-43: Information activity map: E-mailing 'happy birthday' over the Internet
The notion of a channel denotes more than just the human-computer interface or physical cabling between agents. It includes all the intermediate structures - inside and outside the agents - that participate in propagating information from some source agent to a destination agent. Often it is not practical to map all these structures, because either they are not known to the person creating the information activity map or their inclusion would make the diagram needlessly complex. For example in Figure 1-43, the channel the computers used to exchange messages was denoted by the letter i, representing the Internet (i: happy birthday, and i: thank you). However, as any networking expert knows , the typical message sent via the Internet passes through a number of technologies, such as bridges and routers, prior to reaching its destination. These structures are implicit in the channels labeled in an information activity map. Thus, a channel in an information activity map must be understood as representing an abbreviation or abridgement of the actually channel, and the analyst must be prepared to expand channels if the diagrams do not provide the answers sought.
One of the primary aims of a map is to help people see solutions to problems - literally. Different kinds of problems require different levels of detail. The classic example is a road map. When one travels between cities, a road map listing major highways is usually at the appropriate level of detail. However, when one travels between buildings within a city, the map must contain more detailed information about the streets , and highway information becomes less important. In an information activity map, one can control the level of detail by using channel labels to represent complex propagation chains. For example, the two individuals using their computers to exchange e-mail messages over the Internet in Figure 1-43, might be redrawn as in Figure 1-44.
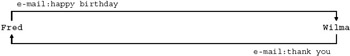
Figure 1-44: Abbreviation for e-mailing 'happy birthday' over the Internet
Once again, the level of detail in an information activity map is determined by the problems the diagram user is trying to solve, as well as what the user is allowed to change in the process that the diagram is based upon. Suppose that the diagram in Figure 1-43 depicted a manager using his or her computer to send a work- related e-mail to an employee, and that the diagram user was an independent business process consultant hired to find ways to improve communication between managers and employees . If the consultant was told that the computer and the Internet were fixed and not subject to replacement by other technologies - but that the software running on the computers was flexible - then an abbreviated diagram similar to Figure 1-44 rather than Figure 1-43 is appropriate, as it shows only what the consultant is able to change.
Application 1: From Social Practice to Technology-Mediated Practice
Each channel and each node in an information activity map represents a possible place where a technology can be substituted. We have already seen one example of technology substituting for a channel - rather than Fred saying happy birthday to Wilma (Figure 1-42, a: happy birthday), he can e-mail the message to her (Figure 1-43, e-mail: happy birthday). For an example of using technology in place of a node, suppose Fred - knowing that he frequently forgets birthdays - enters Wilma's birthday into a 'bot' that automatically sends an e-mail to her wishing her happy birthday. In this case, the bot is a technology that substitutes for Fred in the process of wishing Wilma happy birthday. Figure 1-45 depicts the information activity map for this node substitution.
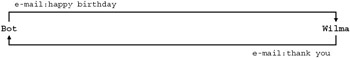
Figure 1-45: Bot automating the e-mailing of 'happy birthday' over the Internet
Application 2: From Technology-Mediated Practice to Social Practice
Conversely, each channel and each node in an information activity map represents a possible place where a person or human medium can be substituted. For example, by substituting a person for the bot and a verbal medium instead of e-mail in Figure 1-45, we can induce the original social process an information system is based on (Figure 1-42).
Application 2 is the primary approach to representational analysis applied in this chapter, namely, taking a technology-mediated activity, mapping its information movement, and through substitution, inducing the unmediated, original social process.
EAN: 2147483647
Pages: 164