Playing "What If?" with Scenarios Say you're purchasing a home and need some idea of how much your monthly mortgage payment is going to be for various loan amounts. You have successfully created a worksheet that determines the monthly payment for a $120,000 house at 6.5%, but you want to know what the payment would be for a $110,000, a $130,000, and a $140,000 home. You also want to see the effects of other loan rates. You could create a bunch of separate worksheets, but a better solution is to create several scenarios for the same worksheet. A scenario is simply a set of values you plug into variables in the worksheet. Excel offers a tool that enables you to plug various sets of values into your formulas to determine the effects of different values on the outcome. The following sections show you how to create and manage your own scenarios. Naming and Saving Different Scenarios Making a scenario is fairly simple. You name the scenario, tell Excel which cells have the values you want to play with, and then type the replacement values you want Excel to use for the scenario. The following step-by-step instructions walk you through the process: -
Display the worksheet for which you want to create a scenario. -
Open the Tools menu and choose Scenarios . The Scenario Manager appears, indicating that this worksheet has no current scenarios. -
Click the Add button. The Add Scenario dialog box appears. -
Type a name for the scenario that describes the specific changes you're going to make. For example, if you were creating this scenario to determine payments for a $130,000 house at 6.75%, you might type 130K @ 6.75% . -
Click the Changing Cells text box, and click the cell that contains the value you want to change in your scenario, as shown in Figure 6.14. To change values in other cells, hold down the Ctrl key and click them. (When you do, Excel inserts the addresses of the changing cells as absolute references, separating them with commas.) Figure 6.14. Choose the cells that contain the values you want to play with. 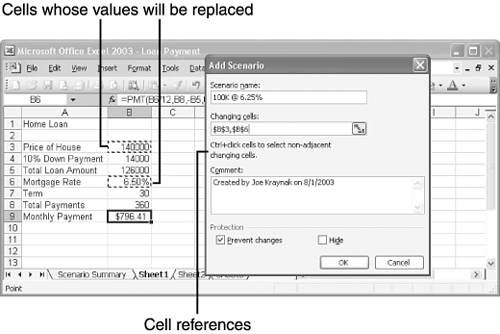 -
Click OK . The Scenario Values dialog box displays the current values in the cells you want to change. -
Type the values you want to use for this scenario, as shown in Figure 6.15, and click OK . The Scenario Manager displays the name of the new scenario. Figure 6.15. To make a scenario, enter different values for the variables. 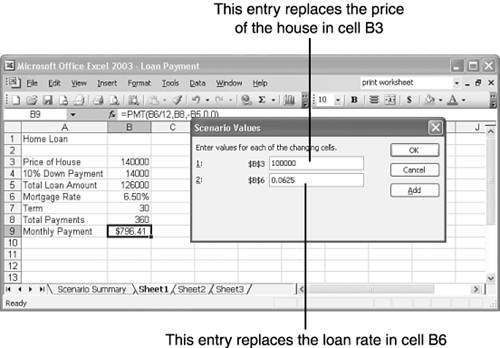 -
To view a scenario, click its name and click the Show button. Excel replaces the values in the changing cells with the values you entered for the scenario. Viewing the Results of Different Scenarios Whenever you want to play with the various scenarios you've created, open the Tools menu and choose Scenarios . When you choose this option, Excel displays the Scenario Manager, introduced in the preceding section. The Scenario Manager offers the following buttons for managing and displaying your scenarios: -
Show : Displays the results of the selected scenario right inside the worksheet. -
Add : Enables you to add another scenario. -
Delete : Removes the selected scenario. -
Edit : Enables you to select different cells used for the scenario and insert different values for the variables. -
Merge : Takes scenarios from various worksheets and places them on a single worksheet. -
Summary : Displays the results of the various worksheets on a single worksheet, as explained in the next section, "Creating a Summary Report." To play "What if?" with various scenarios, follow these steps to shift from one scenario to another: -
Open the Tools menu and choose Scenarios . The Scenario Manager appears. -
Click the name of the scenario you want to view. -
Click the Show button. Excel replaces the values in the changing cells with the values from the scenario and shows the results. See Figure 6.16. Figure 6.16. Scenario Manager enables you to flip through the various scenarios to compare results. 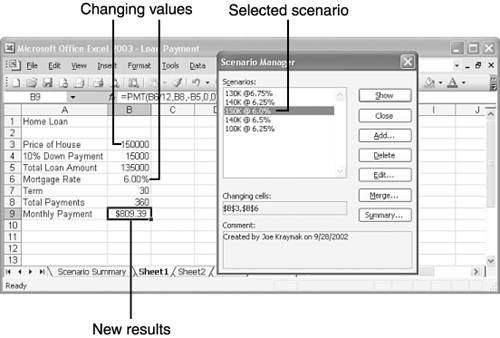 -
Repeat Steps 2 and 3 for any other scenarios you want to view. -
When you're finished examining scenarios, click the Close button. Caution  | When working with scenarios, make sure the Auto Calculate feature is on, as explained earlier in this chapter. If the Calculation option is set to Manual, whenever you choose a scenario in the Scenario Manager and click Show, Excel does not recalculate the result using the scenario's values. To see the results, you must then close the Scenario Manager and press F9 to calculate the results. |
Creating a Summary Report Flipping through scenarios is an excellent way to see how the various scenarios affect the bottom line, but for a more thorough approach, consider creating a scenario report . A scenario report is a new, separate worksheet that displays the results of all your scenarios on a single page. And best of all, scenario reports are easy to create. Take the following steps: -
Open the workbook that contains the desired scenarios. -
Open the Tools menu and choose Scenarios . The Scenario Manager appears. -
Click the Summary button. The Scenario Summary dialog box appears, prompting you to choose a report type and specify the cell in which the result appears. -
Make sure Scenario Summary is selected and that the cell in which the scenario's result is displayed is selected. -
Click OK . Excel creates a scenario report and displays a new worksheet tab for it, called Scenario Summary, as shown in Figure 6.17. Figure 6.17. The Scenario Summary Report displays the results for all your scenarios on a single worksheet. 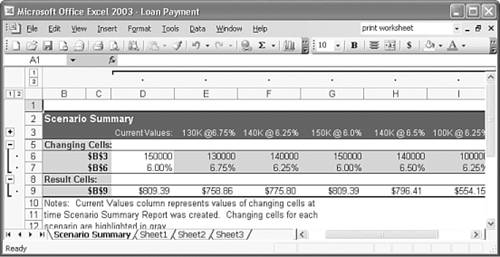 -
When you're finished with the report, simply click the tab for a different worksheet. To get rid of the scenario report altogether, right-click the Scenario Summary tab and select Delete . The Absolute Minimum The most powerful features of any worksheet are the formulas and functions it contains. You can now create custom accounting sheets, complete with their very own built-in calculators . Specifically, you learned how to Control the order in which Excel carries out its mathematical operations. Enter formulas by typing them or using the point-and-click technique. Copy and paste formulas and control cell references in formulas by marking them as absolute or relative. Insert functions for performing more complex mathematical operations. Track down the cause of many of the most common formula errors. Play "What if?" by creating scenarios that substitute one set of key values for another set of key values in a worksheet. With the skills you acquired in this chapter, you can create a dynamic worksheet capable of computing accurate results in a matter of seconds. In addition, you can safely experiment with other values without affecting the condition of your original worksheet. Now that you have a working worksheet, it's time to move on to the next part, "Formatting, Charting, and Printing Your Worksheet." | |