Starting and Using the GroupWise Monitor Agent
| You've now installed the GroupWise Monitor Agent on either Windows or Linux and configured your environment. Now let's see how to load the GroupWise Monitor Agent. Starting the GroupWise Monitor Agent on WindowsOn Windows the GroupWise Monitor Agent is installed to the Start, Programs menu tree of the Windows computer where GroupWise Monitor Agent was installed. By default, GroupWise Monitor is installed in a folder under Start, Programs, Novell GroupWise Monitor. Note The GroupWise Monitor Agent does not run as a Windows service. Thus, if the Windows machine that is running the GroupWise Monitor Agent is restarted, the GroupWise Monitor Agent will not run until someone logs in to the Windows machine. Using the GroupWise Monitor AgentAfter starting the GroupWise Monitor Agent, you get a list of the agents that the GroupWise Monitor Agent was able to discover from your GroupWise system. This list is generated when the Monitor Agent reads the WPDOMAIN.DB file for information about the system. By default, all agents will be placed in a folder in the left pane that is your GroupWise system name. GroupWise Monitor is a very powerful and configurable tool. It's kind of like a piece of soft clay. You can mold GroupWise Monitor into many tools. Thus, this chapter gives an explanation of some of the menu selections in GroupWise Monitor. There are no "best practices" for configuring GroupWise Monitor, so this chapter doesn't tell you how to configure GroupWise Monitor, or which fields to enable. Instead, it just explains the functional purposes of many of the features in the GroupWise Monitor. It is best to explore GroupWise Monitor and construct your own monitoring solution with GroupWise Monitor. The whole idea of GroupWise Monitor is to allow you to view the state of your GroupWise system and notify you of problems or potential problems. The GroupWise Monitor Agent introduces the concept of grouping your various agents together in whatever type of groups you want. This gives the administrator the capability to logically or physically organize all the GroupWise agents in the system in whatever manner makes sense for your particular GroupWise system. For example, you can create a folder for each site of your company. You can then create subfolders to organize your agents. To create folders, right-click any parent folder and choose Create. You can then create a group or a folder to drag agents into. Figure 18.6 shows you the WorldWide Widgets Monitor and illustrates how various folders have been created to organize the agents. Figure 18.6. The GroupWise Monitor Agent displays the status of all GroupWise Agents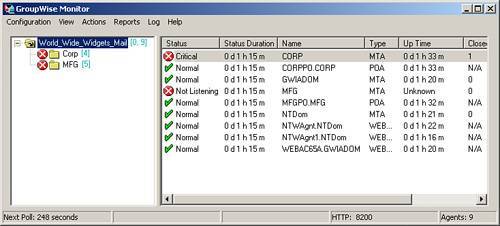 Tip When you drag and drop agents into various folders, they are moved into the destination folder. However, you can have parent folders display the agents contained in child folders by right-clicking the parent folder and selecting Show Subgroup Agents. This places a small black down arrow on the folder to signify that this folder is set to view its subfolders' agents. When you load the GroupWise Monitor Agent, the agent will read the monitor.xml file to determine where the WPDOMAIN.DB file is. It will then connect into the WPDOMAIN.DB file to identify which agents you have in your GroupWise system. Next, it will attempt to open an HTTP connection to each agent. If your agents are password protected on their HTTP port, you might get a pop-up prompt for each agent in order to enter the agent's HTTP user and password settings. If you see this, it is because the agent's HTTP user and password settings are not stored in the WPDOMAIN.DB file and are most likely set up in the agent's startup file. Because of this, it is much easier to define the HTTP user and password on your various GroupWise agents through ConsoleOne so that this information is in the WPDOMAIN.DB file, and the Monitor Agent can read this to authenticate to the agent. You can attempt to work around the pop-ups by using some startup switches on the Monitor Agent that feed the HTTP user and password settings into the various GroupWise agents for monitoring them. The /httpuser- and /httppassword- switches are placed on the command line where you load the Monitor Agent. Here's an example of how this might look on Windows: C:\gwmon\gwmon.exe /lang-us /httpuser-webmon /httppassword-letmein The GroupWise Monitor Agent supports several other switches that may be of interest to you. To discover these switches, run the GroupWise Monitor Agent with the /? switch (on the Windows platform). For example: C:\gwmon\gwmon.exe /? The next sections talk about how to enable three kinds of notifications:
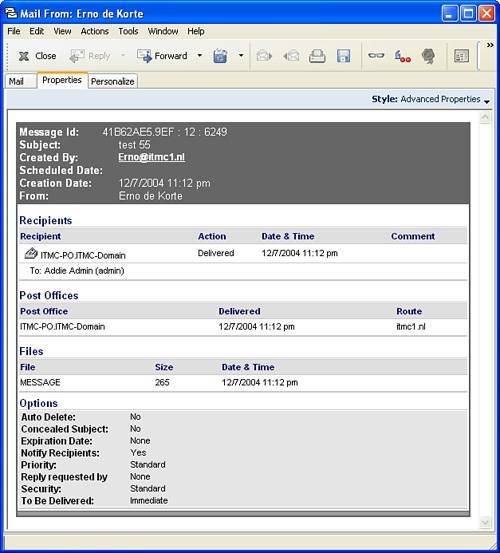
Configuring Visual Notification: GroupWise Monitor Agent InterfaceThe main GroupWise Monitor Agent screen, shown in Figure 18.6, gives you an eagle's-eye view of the state of your GroupWise system. The goal is to see green check marks next to each agent. If you see a red circle with an x through it, or a yellow circle with an exclamation mark in it, these are visual alerts that either an agent is down or GroupWise Monitor cannot get hold of an agent for some reason. When an agent in a particular folder has a visual alert on it, the alert icon is placed next to the folder. This allows you to quickly identify whether any agents in any folder are in an alerted state. You can get more information about any one of your GroupWise agents by double-clicking the agent. A details screen comes up, as shown in Figure 18.7. Figure 18.7. Agent Details shows why GroupWise Monitor flagged an agent as having problems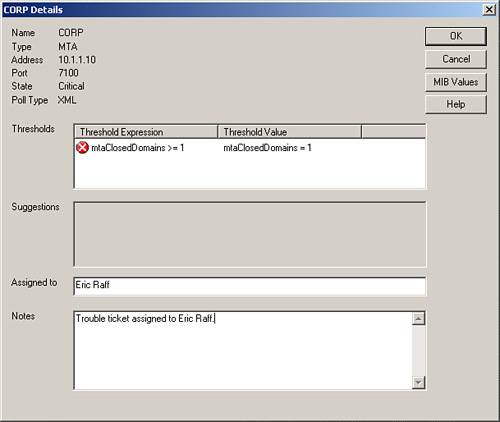 You can get even more details by viewing the SNMP values that the agent makes available. To do this, click the MIB Values button. Figure 18.8 shows the MIB values that come up on a POA agent. Figure 18.8. The SNMP/MIB values on a POA show which settings from a POA can be monitored with an SNMP request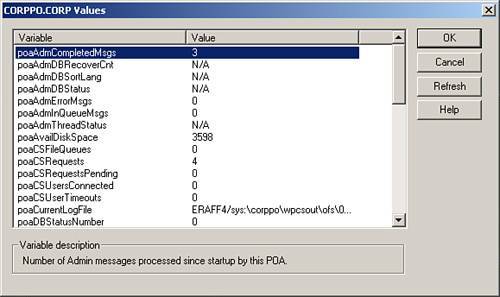 The SNMP/MIB values of an agent contain the information you can monitor. By default, the Monitor Agent will query the agents via the HTTP port of the agent. If this port is inaccessible, it will revert to using SNMP to poll the agent. The Poll Type is identified on the Agent Details dialog box, as illustrated in Figure 18.7. If it is XML, the Monitor Agent is using the HTTP port to poll the agent. If you see the Poll Type of SNMP, you know that the Monitor Agent is using the SNMP protocol to poll this particular agent. ReportsWith the Reports option, you can get real-time reports of configuration information, message flow, and so on. The reports features are pretty self-explanatory. What you should know, though, is that the user traffic, link traffic, and message tracking features all derive information from the message logs of the GroupWise MTAs in your system. These aren't the regular logs the MTA uses; these are the special logs that are enabled when MTA message logging is enabled. Enabling MTA message logging was explained earlier in this chapter. EnvironmentThe Environment report option will show you information about your entire GroupWise environment. It displays things like the agent name, the agent type, the agent version, the agent's IP address, the agent's port, and the server that the agent is running on. You can also opt to send this report to any email address. When you click the Send icon when viewing the Environment report, you can enter the From and To email address and the Monitor Agent will act like an SMTP server to send the message out. User TrafficThe User Traffic report can track the messages sent by a particular user, within a time frame that you specify. Link TrafficThe Link Traffic report tracks the number of messages sent between domains in your system. Message TrackingMessage Tracking is a powerful but complex feature. As shown in Figure 18.9, this feature requires some investigation on your part. Figure 18.9. The Message Tracking Report feature allows you to search for a particular message to determine when it passed through the MTA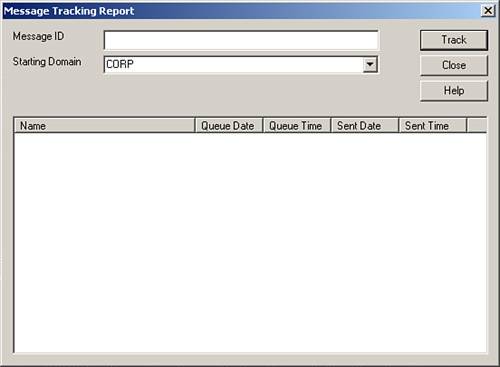 First here's a scenario in which you might use this feature:
You are the administrator; you want to know what happened to the message. Here is the information you would gather:
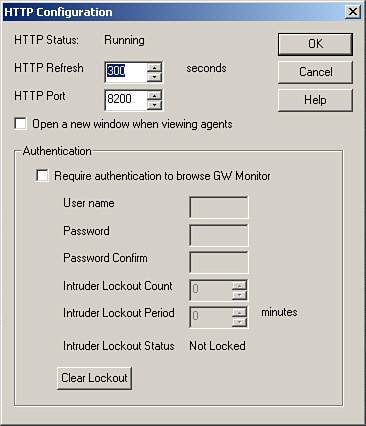
This section explained how to track a message. For a message to be tracked, it must be sent to at least one recipient outside the post office. Performance TestingWith the Performance Testing feature GroupWise Monitor can send a message at a regular interval, and at that moment test the speed of message delivery and processing. First you must configure Performance Testing under Configuration, Performance Testing. After you have configured Performance Testing, you can select Reports, Performance Testing and see a nicely configured report showing the performance trends. Link TraceLink Trace is a great tool that allows you to quickly and easily trace the link(s) from one MTA to another in your GroupWise system. Figure 18.11 displays the Link Trace tool with a link traced from the CORP domain to the MFG domain. You can see that the CORP domain is linked directly to the MFG domain, that the link is open, and that there are no queued messages waiting to be sent from CORP to MFG. In a large GroupWise system, this tool can be invaluable in identifying how the link configuration is defined on your system. Figure 18.11. You can use Link Trace to trace MTA-to-MTA links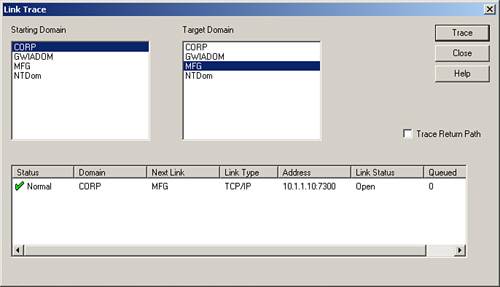 You can also place a check mark in the Trace Return Path option to have the Link Trace tool trace the links in both directions. For example, it will check the link from CORP to MFG, and then back from MFG to CORP in one step. This is useful to identify whether the two domains are configured correctly from the perspective of each MTA. One thing to note is that if there are problems in your link configuration, this tool will detect them and will show a visual alert. Link ConfigurationThe Link Configuration tool is used when you need to know how an MTA talks to all other domains in the system. You can also use it to run a report on every MTA in the system, and what this MTA's link configuration is. Once again, if there are problems such as link configuration loops in your system, this tool will identify them and alert you with a visual alert. Figure 18.12 shows the link configuration of the MFG domain. Notice that MFG's link to Ntdom is an indirect link through the CORP domain. Figure 18.12. The Link Configuration tool can trace the speed of domain-to-domain links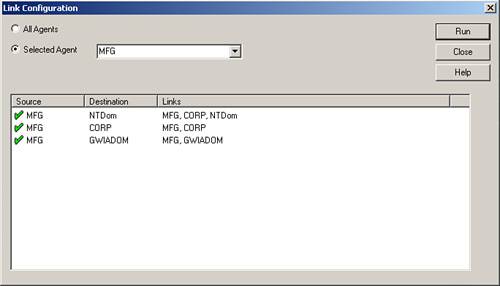 Configuring Visual Notification: GroupWise Monitor Agent HTTP InterfaceThe GroupWise Monitor interface allows you to define custom SNMP monitoring views of your GroupWise system. The GroupWise Monitor has a Web-browser interface, and you can use GroupWise Monitor, even when you are away from the machine running the GroupWise Monitor Agent. To enable HTTP monitoring and to enable the HTTP interface to gain quick access to GroupWise agents, you need to define a user and password in order to access the HTTP port of the Monitor Agent. This allows you to check your GroupWise system by accessing the HTTP port of the agent directly. You can define the HTTP user and password on the agent by going to Configuration, HTTP and selecting the option to Require Authentication to Browse GW Monitor. Next, you define the user and password switches, and, if desired, you can define the intruder detection. Specifying the HTTP Port for GroupWise Monitor AgentThe GroupWise Monitor Agent listens on a configurable port. You should check to see whether this port is enabled, and what it is enabled for. To do this, go to Configuration, HTTP in the GroupWise Monitor Agent Windows interface, as shown in Figure 18.13. Figure 18.13. HTTP configuration for the GroupWise Monitor Agent can be configured using a number of settings Make sure that the HTTP Port field is filled in, and make note of this port. Accessing the HTTP Interface Through a Web BrowserHere is how you access the HTTP interface of the GroupWise Monitor Agent through your Web browser. Use the following line in your browser: http://monitor computer's IP address or DNS name:monitor's HTTP port For example: http://137.65.32.63:8200 You should get an interface similar to the one shown in Figure 18.14. Figure 18.14. The GroupWise Monitor Agent as it appears in a Web browser interface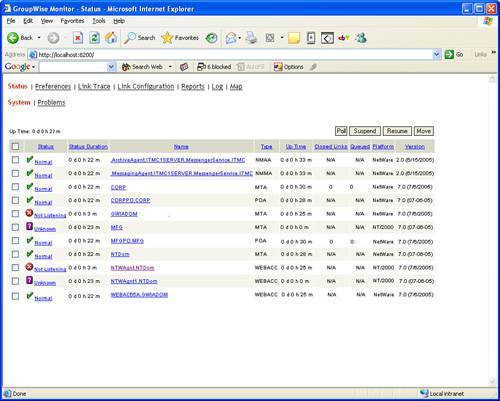 After you are in, you get an interface that is much like the Windows interface. There are a few distinct advantages to this interface:
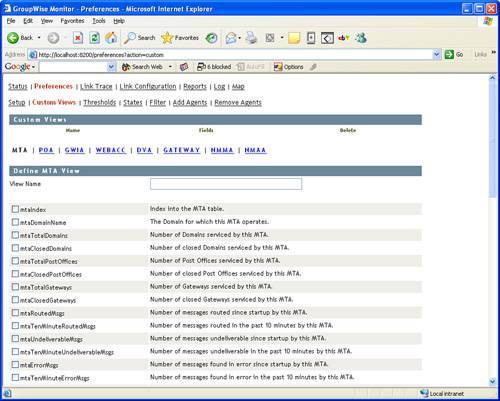
HTTP Access to GroupWise AgentsFrom the main status screen in the Web browser interface of GroupWise Monitor, you can click any of the agents in the Name column, and you are immediately transported to the HTTP port of that agent and the resulting HTTP interface of that agent. Tip You can configure GroupWise Monitor to open the HTTP screen of agents in a new browser window. This way, you always have GroupWise Monitor, and you can access the HTTP interfaces of your other GroupWise agents at the same time. To do this, go back into the GroupWise Monitor's Windows interface and choose Configuration, HTTP. In the HTTP Configuration window, check the Open a New Window When Viewing Agents option. Custom ViewsWith custom views, you can define the SNMP traps that you want to monitor (see Figure 18.15). Rather than explaining these traps (there are more than 200 of them), you can go to the status screen in the Web-browser interface and click an agent along the Status column. Here you will see each of the SNMP values filled in for that agent. With a little bit of thinking and matching, you should be able to determine the SNMP traps available to you. Now you can create an SNMP custom view:
This section explained visual notification by the WebAccess Agent. The next section explains how to get audio notification from the WebAccess Agent. Configuring Audio NotificationThe GroupWise Monitor Agent can play sounds when certain events have happened. This is useful if the GroupWise Monitor Agent is in earshot of your desk. To enable audio notification, choose Configuration, Notification, and then check the Play Sound option. To define the sounds you will hear with various thresholds, click the Sounds button, and you will see the window shown in Figure 18.16. Figure 18.16. GroupWise Monitor sounds can be customized according to the nature of the event that causes Monitor to make an audible notification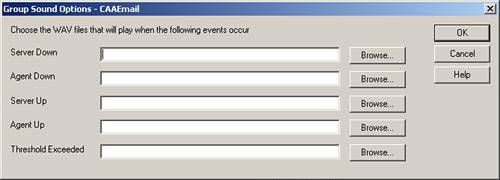 You can browse to find sound files that will play on the events shown in the Sound Options window. Configuring Remote NotificationThis is a powerful notification method. With remote notification, you can have GroupWise Monitor send a message to the Internet email address for your pager, as well as to other email addresses. Here's how to do it:
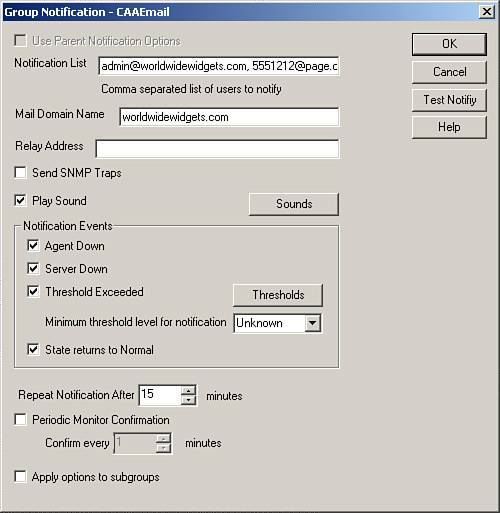
Tip You can leave the Relay address blank and the Monitor Agent will send the email directly to the destination SMTP mail servers. This works because the Monitor Agent has its own built-in SMTP server that allows it to send mail directly. You'll normally use a relay server only if the box that is running the Monitor Agent is not able to do the DNS lookup. Figure 18.17 shows the GroupWise Monitor configured for remote notification. Figure 18.17. The Group Notification window shows that more than one email can be notified by GroupWise Monitor |
EAN: 2147483647
Pages: 320