Chapter 18: Tracing for Vulnerabilities
Overview
Current auditing technologies such as source auditing and machine-code auditing are designed to be used on an application while it is on disk. These technologies offer a software company a huge advantage when identifying potential vulnerabilities in its software. A source/binary auditing application can identify vulnerabilities deep inside application code, but rarely can it determine whether prior security checks prohibit the vulnerability from being exploited. For example, an auditing application can determine whether a function prone to flaws, such as strcpy , is being used in an application. The auditing application rarely, if ever, can determine whether length checks or other sanitization checks performed on the input data are supplied to the strcpy that would make the exploitation of the identified strcpy function possible.
Software companies with good security policies will correct potential security issues in their software even if the issues haven't been proven to be a direct threat. Unfortunately, it is much more difficult for researchers, who work outside that software company, to convince the software company to remove potential vulnerabilities from their software. Researchers typically must identify a flaw in a product and produce a formal process or application to present the discovered flaw in such a way that the software company will feel compelled to eliminate it from the product. For this reason we generally have to identify vulnerabilities in a software product as well as identify an execution path that we can use to navigate to that particular vulnerability. By intercepting all the vulnerable points in a software application, we can monitor their use and record details such as the execution path that was traveled to reach the particular vulnerable function. By intercepting application code that performs security checks, we can determine whether security checks are performed on arguments supplied to that function.
A Vulnerable Program
In our sample program, we will see a security problem common to today's software products ”a buffer overflow. The programmer assumes he has limited lstrcpynA to copy 15 bytes ( USERMAXSIZE-1 ) to the destination buffer. Unfortunately, the developer made a simple mistake and used the wrong length definition, allowing more data to be copied to the designated region than was expected.
Many software developers use define to help organize length sizes in their programs. Often a developer will use the define but unintentionally add a serious vulnerability to their application.
The sample program has a buffer overflow vulnerability in the check_username function. The maximum copy length supplied to lstrcpynA is larger than the destination buffer . Since the variable buffer is only 16 bytes, the remaining 16 bytes will overflow out of buffer onto the saved EBP and saved EIP of our previous stack frame.
/* Vulnerable Program (vuln.c)*/ #include <windows.h> #include <stdio.h> #define USERMAXSIZE 32 #define USERMAXLEN 16 int check_username(char *username) { char buffer[USERMAXLEN]; lstrcpynA(buffer, username, USERMAXSIZE-1); /* Other function code to examine username ... */ return(0); } int main(int argc, char **argv) { if(argc != 2) { fprintf(stderr, "Usage: %s <buffer>\n", argv[0]); exit(-1); } while(1) { check_username(argv[1]); Sleep(1000); } return(0); } Many developers use tools such as Visual Assist to aid them and some of these development tools offer features such as TAB completion . In this example, the programmer may have been begun to type USERMAXSIZE , and the development tool offered the string USERMAXNAME . The developer hits the TAB key, assuming that this is the correct define, and unknowingly creates a serious vulnerability in the software package. A malicious user can supply more than 15 bytes for the username argument, and application data on the stack will be overwritten. In turn , that may be used to gain execution control of the application.
How can the software developer audit a program for these vulnerabilities? If the source-auditing application used has a built-in preprocessor or the source auditor is used on code that is already preprocessed, then the source-auditing technology may identify this flaw. A machine-code auditing application may identify this flaw by first recognizing the use of a potentially vulnerable function and then examining the size of the destination buffer as well as the allowed length supplied to the function. If the length is greater than the size of the destination buffer, then the machine-code auditing tool can report a potential vulnerability.
What if the destination buffer was a block located in the heap? Since items in the heap are only created during runtime, determining the size of the heap block becomes very difficult. Source/machine-code auditing suites may attempt to examine the application code for instances of the destination heap block being allocated, and then cross-reference that with potential execution flow. This method is the proposed solution by most source/machine-auditing solution developers. Unfortunately, the word proposed doesn't offer the same comfort as the word implemented . We can solve this problem by examining the heap block header, and when necessary, walk the block list for the pertinent block within the particular heap. Most compilers will also create their own heaps. If we want to audit applications built by specific compilers, we'll need to incorporate support to analyze their heaps into our tracing application.
Notice the use of lstrcpynA in our sample. This function is not a standard C runtime function. It is implemented within a Microsoft system dll and, besides its accepted arguments, it has a completely different signature than its distant cousin, strncpy . Every operating system creates its own versions of common C runtime functions that cater more closely to its needs. Source and machine-code auditing technologies are rarely, if ever, updated to look for these third-party functions. This problem cannot be directly solved with vulnerability tracing; this point was made only to show another avenue that is often overlooked by auditing systems.
Software protection technologies also severely cripple static machine-code auditing technologies. Many software protection schemes encrypt and/or compress code sections in an attempt to make it difficult to reverse. Although software crackers manually bypass these schemes with ease, they are extremely difficult to navigate around using an automated technology. Fortunately, most if not all the protection schemes are designed to protect an application while it is on disk. Once the application is decrypted, decompressed, and loaded into an address space, these protection schemes are no longer as apparent.
Function pointers and callbacks also offer problems for machine-code auditing solutions. Many of these are not initialized until the application is executing, and we can analyze an application's flow of execution only by how entry points are referenced. Since these references are not initialized , our execution analysis is further complicated.
Now that we have presented a few issues with some of the modern auditing systems, let's show how we can conquer them by designing a vulnerability tracing application of our own. From this point, we'll call our vulnerability trace utility VulnTrace. It has several limitations that will need to be overcome , but it should offer a starting point that will hopefully foster interest in vulnerability tracing technologies.
Component Design
First let's establish what components are required to monitor our example application. Like any project, we'll need to define exactly what we'll need for our solution.
We need to be able to access the target application directly and frequently. Because we'll need to read portions of the process memory and redirect execution of the process into our own code, we will need to position ourselves in an area inside the virtual address space of the target application. Our solution will be to create VulnTrace as a dll and inject it inside the target process. From within the address space of our target application, VulnTrace will be able to observe the application and modify its behavior with ease.
We will need to be able to analyze loaded modules for vulnerable behavior such as the abnormal or insecure use of various functions. These functions may be imported, statically linked, or inlined , so a degree of machine-code analysis will be needed so we can locate these functions.
We will need to intercept the execution of various functions so that VulnTrace can examine their arguments. To solve this problem we'll use function hooking . Function hooking is the process of replacing functions in other dlls with functions from your own dlls .
Last, but not least, once our data is collected, we'll need to deliver it to the auditor, so we must implement some sort of delivery mechanism. For our example, we will use the debug messaging system in the Windows operating system. We can deliver a message to the debugging system with just one API call. To retrieve these messages, we can use the Detours tool from Microsoft (discussed later), a free tool available to anyone with Internet access ().
Our VulnTrace components so far are:
-
Process injection
-
Machine-code analysis
-
Function hooking
-
Data collection and delivery
We will now explain the design and characteristics of each of these components in depth and then finally combine them to build our first vulnerability tracing program.
Process Injection
VulnTrace will need to redirect the execution of the target application into a controlled area where the calling behavior of vulnerable routines can be examined. The ability to frequently examine the address space of the target process will also be required. We could do this all externally, but we would have to develop a translation scheme to separate our address space from the target address space. The overhead in this scheme is as unreasonable as its implementation. A far better and more reliable solution is to simply inject our code into the address space of the target application. We will use the Detours suite available from Microsoft Research ( http://research.microsoft.com/sn/detours ). The Detours suite includes many useful functions and sample code that we can use to quickly and easily develop tracing solutions.
VulnTrace will be built as a dll and loaded into the target process using the Detours API. If you wish to write your own function to load your library into the target process address space you can do the following:
-
Allocate a page inside the process using VirtualAllocEx .
-
Copy in arguments necessary for a LoadLibrary call.
-
Call LoadLibrary inside the process using CreateRemoteThread , and specify the addresses of your arguments inside the process' address space.
Machine-Code Analysis
We will need to locate every instance of each function we want to monitor, and there may be many different versions across multiple modules. The functions we are interested in monitoring will be incorporated into our address space using one or more of the following schemes.
Static Linking
Many compilers have their own versions of common runtime functions. If the compiler recognizes the use of these functions, the compiler may build its own version of these functions into the target application. For example, if you build a program that uses strncpy , Microsoft Visual C++ will statically link its version of strncpy into your application. The following is an assembly excerpt from a simple program that from the main routine calls the function check_username , and then finally calls strncpy . Since the function strncpy was available to the compiler from one of its runtime libraries, it was linked into the application directly below the main routine. When the function check_username calls the function strncpy , execution will continue directly below to strncpy located at the virtual address 0x00401030 . The left column represents the virtual addresses of the instructions displayed in the right column.
check_username: 00401000 push ebp 00401001 mov ebp,esp 00401003 sub esp,10h 00401006 push 0Fh 00401008 lea eax,[buffer] 0040100B push dword ptr [username] 0040100E push eax 0040100F call _strncpy (00401030) 00401014 add esp,0Ch 00401017 xor eax,eax 00401019 leave 0040101A ret main: 0040101B push offset string "test" (00407030) 00401020 call check_username (00401000) 00401025 pop ecx 00401026 jmp main (0040101b) 00401028 int 3 00401029 int 3 0040102A int 3 0040102B int 3 0040102C int 3 0040102D int 3 0040102E int 3 0040102F int 3 _strncpy: 00401030 mov ecx,dword ptr [esp+0Ch] 00401034 push edi 00401035 test ecx,ecx 00401037 je _strncpy+83h (004010b3) 00401039 push esi 0040103A push ebx 0040103B mov ebx,ecx 0040103D mov esi,dword ptr [esp+14h] 00401041 test esi,3 00401047 mov edi,dword ptr [esp+10h] 0040104B jne _strncpy+24h (00401054) 0040104D shr ecx,2 ...
If we want to intercept these statically linked vulnerable functions, we will need to develop a fingerprint for each statically linked function. We can use these fingerprints to scan the code portions of each module in our address space and locate statically linked functions.
Importing
Many operating systems include support for dynamic libraries, a flexible alternative to the static libraries that are generally linked in during the build process. When a software developer uses functions in his program that are specifically defined to exist in an external module, the compiler must build dependencies into the program. When a developer includes the use of these routines in his program, various data structures are incorporated into the built program image. These data structures, or import tables , will be analyzed by the system loader during the load process. Each entry in the import table specifies a module that will need to be loaded. For each module there will be a list of functions that will need to be imported for that particular module. During the load process, the address of each function being imported will be stored in an Import Address Table (IAT) located within the module or program that is doing the importing.
The following program has one routine, check_username , that uses an imported function, lstrcpynA . When the check_username function reaches the call instruction located at the virtual address 0x0040100F , execution will then be redirected to the address stored at the location 0x0040604C . This address is an entry in our vulnerable program's IAT. It represents the address of the entry point of the function lstrcpynA .
check_username: 00401000 push ebp 00401001 mov ebp,esp 00401003 sub esp,10h 00401006 push 20h 00401008 lea eax,[buffer] 0040100B push dword ptr [username] 0040100E push eax 0040100F call dword ptr [__imp__lstrcpynA@12 (0040604c)] 00401015 xor eax,eax 00401017 leave 00401018 ret main: 00401019 push offset string "test" (00407030) 0040101E call check_username (00401000) 00401023 pop ecx 00401024 jmp main (00401019)
The following is a simple snapshot of the IAT for our vulnerable program. The address that was being referenced by the call instruction within the function check_username can be seen below.
Import Address Table Offset Entry Point 0040604C 7C4EFA6D <-- lstrcpynA entry point address 00406050 7C4F4567 <-- other import function entry points 00406054 7C4FAE05 ... 00406058 7C4FE2DC ... 0040605C 77FCC7D3 ...
As you can see, the address in the IAT, 0x7C4EFA6D , does in fact reference the entry point address of lstrcpynA .
_lstrcpynA@12: 7C4EFA6D push ebp 7C4EFA6E mov ebp,esp 7C4EFA70 push 0FFh ...
If we want to intercept imported functions, we have several options. We can change addresses in the IAT of our target module so that they point to our hook functions. This method will allow us to monitor the use of a function of interest only within a certain module. If we want to monitor every use of a function, regardless of the module that is accessing it, we can modify the function code itself to redirect somewhere else temporarily during execution.
Inlining
Most compilers available to developers offer the ability to optimize program code. Various simple runtime functions such as strcpy , strlen , and others are built into a routine where they are used versus being statically linked or imported. By building the needed code for a function directly into the function that uses it, we have a significant performance gain in the application.
The following demonstrates the function strlen being inlined by the Microsoft Visual C++ compiler. In this example, we push the address of the string we want to length check onto the stack. Then, we call the statically linked version of strlen . When it returns, we adjust the stack pointer, then release the argument we previously supplied, and finally we store the length returned by strlen into the length variable.
Without optimizations: 00401006 mov eax,dword ptr [buffer] 00401009 push eax 0040100A call _strlen (004010d0) 0040100F add esp,4 00401012 mov dword ptr [length],eax
Below, we have the inlined version of strlen . This was created by switching our build environment to release mode. You can see that we are no longer calling out to the strlen function. Instead, the functionality of strlen has been ripped out and plugged directly into the code. We zero out the EAX register, and scan the string referenced by EDI for a zero byte ( NULL ). When we've found the zero byte, we take the counter and store it into the length variable named.
With optimizations: 00401007 mov edi,dword ptr [buffer] 0040100A or ecx,0FFFFFFFFh 0040100D xor eax,eax 0040100F repne scas byte ptr [edi] 00401011 not ecx 00401013 add ecx,0FFFFFFFFh 00401016 mov dword ptr [length],ecx
If we want to monitor the use of these inlined functions, we can use breakpoints, monitor the exceptions, and gather information from the context structures. This method may also be used to monitor parsers.
Function Hooking
Now that we've discussed how to identify various types of functions, we need to be able to collect information about their use. Our solution will be prelude hooking . For those of you who are unfamiliar with hooking schemes, we offer a brief overview of the common hooking techniques.
Import Hooking
Import hooking is the most common method of hooking. Each loaded module has an import table. The import table is processed when the module is loaded into the virtual address space of the target process. For each function that is imported from an external module, an entry is created in the Import Address Table (IAT). Each time the imported function is called from within the loaded module, execution is redirected to the associated address specified in the IAT. In Figure 18.1, we can see functions within the two separate modules calling the function lstrcpynA , located within the kernel32 module. When we begin to execute the lstrcpynA function, we are transferred to the address specified in our module's IAT. Once we're finished executing the lstrcpynA function, we will return back into the function that originally called lstrcpynA .
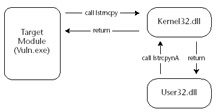
Figure 18.1: Normal Execution Flow of Our Example Vulnerable Program
We can hook imported functions by replacing their address in the IAT with the address of the code we want to redirect execution to. Since each module has its own IAT, we will need to replace the entry point for lstrcpynA in the IAT for each module we want to monitor. In Figure 18.2 we replaced the IAT entries for lstrcpynA in the user32.dll module as well as the vuln.exe module. Each time code within these modules executes the lstrcpynA function, execution will be transferred to the address we inserted into the IAT.
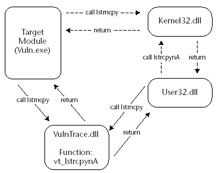
Figure 18.2: Execution flow of our example vulnerable program after we have modified the import table of the loaded module user32.dll.
This function simply examines the parameters that were intended for the original lstrcpynA and then returns execution to the function that unknowingly executed it. This new address is an entry point into the function vt_lstrcpynA , located inside our VulnTrace.dll .
Prelude Hooking
With import hooking, we modified the IAT in each module that imports the function that we want to monitor. We mentioned earlier that import hooking is effective when we want to monitor only function use from a particular module. If we want to monitor the use of a function regardless of from where it is being called, we can place our hook directly inside the code of the function that we want to monitor. We simply insert a jmp instruction in the procedure prelude of target function that we want to monitor. This jmp instruction will reference the address of the code we want to redirect to upon execution of the intercepted function.
This scheme will allow us to catch every use of the particular function we want to monitor. In Figure 18.3, we can see functions within the two separate modules calling the function lstrcpynA , located within the kernel32 module.
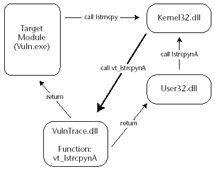
Figure 18.3: Execution flow of our example vulnerable program after we have modified the prelude of the function lstrcpynA within the loaded module kernel32.dll .
When we begin to execute the lstrcpynA function, we are transferred to the address specified in our module's IAT. Instead of executing the entire lstrcpynA function, we hit the jmp instruction that was created when we inserted our hook. When the jmp instruction is executed we are redirected into a new function, vt_lstrcpynA , located inside our VulnTrace.dll . This function examines the parameters that were intended for the original lstrcpynA and then executes the original lstrcpynA .
To implement this hooking scheme we can use the function DetourFunctionWithTrampoline included in the Detours API suite. Later in this chapter we will demonstrate how we can use the Detours API suite to hook the preludes of functions we want to monitor.
Prologue Hooking
Prologue hooking is very similar to prelude hooking. The significant difference is that we take control of the function after it has finished but before it returns to its caller. This allows us to examine the results of a function. For example, if we want to see what data was received using a network function, we'll need to use a prologue hook.
Data Collection
After we have identified a function we want to monitor and we're ready to put a hook in place, we have to decide where to temporarily redirect execution of the hooked function. For our example tracing application VulnTrace, we will hook lstrcpynA and redirect its execution to a hook designed to specifically to gather information about the arguments supplied to the real lstrcpynA . Once the caller has entered our custom lstrcpynA , we will gather information about its arguments and then deliver it using a function included with the Microsoft debugging API. The function OutputDebugString will deliver our collected data to the Microsoft debugging subsystem. We can monitor the messages delivered by VulnTrace using the utility DebugView, available from www.sysinternals.com .
The following shows our new function vt_lstrcpynA at work.
char *vt_lstrcpynA (char *dest,char *source,int maxlen) { char dbgmsg[1024]; LPTSTR retval; _snprintf(dbgmsg, sizeof(dbgmsg), "[VulnTrace]: lstrcpynA(0x%08x, %s, %d)\n", dest, source, maxlen ); dbgmsg[sizeof(dbgmsg)-1] = 0; OutputDebugString(dbgmsg); retval = real_lstrcpynA(dest, source, maxlen); return(retval); } When the vulnerable application ( vuln.exe ) calls lstrcpynA , execution is redirected into vt_lstrcpynA . In this example, we deliver basic information about the arguments intended for lstrcpynA using the debugging _subsystem.
Building VulnTrace
Before we begin discussing each of the vulnerability tracing components, you will need to acquire the following applications to build and use VulnTrace.
-
Microsoft Visual C++ 6.0 (or any other Windows C/C++ compiler)
-
Detours ( http://research.microsoft.com )
-
DebugView ( www.sysinternals.com )
The following sections discuss each piece of our vulnerability tracing solution. You can use the components to trace the buffer overflow vulnerability in the example program we displayed at the beginning of this chapter.
VTInject
This program can be used to inject VulnTrace into the process we want to audit. Simply compile it as an executable ( VTInject.exe ). Remember that you will need to include the Detours header file and link with the Detours library ( detours.lib ). To do this, add the Detours directory into your library and include the path within your compiler. To use VTInject, just supply a process ID of (PID) as the first and only argument. VTinect will then load the VulnTrace.dll from the current directory into the target process. Verify that the compiled VulnTrace.dll (source available below) is located in the same directory as VTInject.exe .
/*********************************************************************** ************\ VTInject.cpp VTInject will adjust the privilege of the current process so we can access processes operating as LOCALSYSTEM. Once the privileges are adjusted VTInject will open a handle to the target process id (PID) and load our VulnTrace.dll into the process. \*********************************************************************** ************/ #include <stdio.h> #include <windows.h> #include "detours.h" #define dllNAME "\VulnTrace.dll" int CDECL inject_dll(DWORD nProcessId, char *szDllPath) { HANDLE token; TOKEN_PRIVILEGES tkp; HANDLE hProc; if(OpenProcessToken( GetCurrentProcess(), TOKEN_ADJUST_PRIVILEGES TOKEN_QUERY, &token) == FALSE) { fprintf(stderr, "OpenProcessToken Failed: 0x%X\n", GetLastError()); return(-1); } if(LookupPrivilegeValue( NULL, "SeDebugPrivilege", &tkp.Privileges[0].Luid) == FALSE) { fprintf(stderr, "LookupPrivilegeValue failed: 0x%X\n", GetLastError()); return(-1); } tkp.PrivilegeCount = 1; tkp.Privileges[0].Attributes = SE_PRIVILEGE_ENABLED; if(AdjustTokenPrivileges( token, FALSE, &tkp, 0, NULL, NULL) == FALSE) { fprintf(stderr, "AdjustTokenPrivileges Failed: 0x%X\n", GetLastError()); return(-1); } CloseHandle(token); hProc = OpenProcess(PROCESS_ALL_ACCESS, FALSE, nProcessId); if (hProc == NULL) { fprintf(stderr, "[VTInject]: OpenProcess(%d) failed: %d\n", nProcessId, GetLastError()); return(-1); } fprintf(stderr, "[VTInject]: Loading %s into %d.\n", szDllPath, nProcessId); fflush(stdout); if (!DetourContinueProcessWithDllA(hProc, szDllPath)) { fprintf(stderr, "DetourContinueProcessWithDll(%s) failed: %d", szDllPath, GetLastError()); return(-1); } return(0); } int main(int argc, char **argv) { char path[1024]; int plen; if(argc!= 2) { fprintf(stderr, "\n-= VulnTrace =-\n\n" "\tUsage: %s <process_id>\n\n" ,argv[0]); return(-1); } plen = GetCurrentDirectory(sizeof(path)-1, path); strncat(path, dllNAME, (sizeof(path)-plen)-1); if(inject_dll(atoi(argv[1]), path)) { fprintf(stderr, "Injection Failed\n"); return(-1); } return(0); }; VulnTrace.dll
The following example library is a combination of a few of the components discussed earlier in this chapter. It will allow us to monitor the use of the lstrcpynA() function used by our application. Simply compile it as a dll and inject it into the vulnerable program using VTInject.
/* * VulnTrace.cpp */ #include "stdafx.h" #include <windows.h> #include <stdio.h> #include "detours.h" DWORD get_mem_size(char *block) { DWORD fnum=0, memsize=0, *frame_ptr=NULL, *prev_frame_ptr=NULL, *stack_base=NULL, *stack_top=NULL; __asm mov eax, dword ptr fs:[4] __asm mov stack_base, eax __asm mov eax, dword ptr fs:[8] __asm mov stack_top, eax __asm mov frame_ptr, ebp if( block < (char *)stack_base && block > (char *)stack_top) for(fnum=0;fnum<=5;fnum++) { if( frame_ptr < (DWORD *)stack_base && frame_ptr > stack_top) { prev_frame_ptr = (DWORD *)*frame_ptr; if( prev_frame_ptr < stack_base && prev_frame_ptr > stack_top) { if(frame_ptr < (DWORD *)block && (DWORD *)block < prev_frame_ptr) { memsize = (DWORD)prev_frame_ptr - (DWORD)block; break; } else frame_ptr = prev_frame_ptr; } } } return(memsize); } DETOUR_TRAMPOLINE(char * WINAPI real_lstrcpynA(char *dest,char *source,int maxlen), lstrcpynA); char * WINAPI vt_lstrcpynA (char *dest,char *source,int maxlen) { char dbgmsg[1024]; LPTSTR retval; _snprintf(dbgmsg, sizeof(dbgmsg), "[VulnTrace]: lstrcpynA(0x%08x:[%d], %s, %d)\n",dest,get_mem_size(dest), source, maxlen); dbgmsg[sizeof(dbgmsg)-1] = 0; OutputDebugString(dbgmsg); retval = real_lstrcpynA(dest, source, maxlen); return(retval); } BOOL APIENTRY DllMain( HANDLE hModule, DWORD ul_reason_for_call, LPVOID lpReserved ) { if (ul_reason_for_call == dll_PROCESS_ATTACH) { DetourFunctionWithTrampoline((PBYTE)real_lstrcpynA, (PBYTE)vt_lstrcpynA); } else if (ul_reason_for_call == dll_PROCESS_DETACH) { OutputDebugString("[*] Unloading VulnTrace\n"); } return TRUE; } Compile VTInject and the sample vulnerable program as executables. Compile VulnTrace as a dll and put it in the same directory as the VTInject executable. When you have completed these steps, start up the vulnerable program as well as DebugView. You may want to configure DebugView to filter out other debug messages so you only see messages coming from VulnTrace. To do this, press Control+L and enter VulnTrace . When you are ready, execute VTInject with the process ID of the vulnerable process as an argument. You should see the following message in DebugView:
... [2864] [VulnTrace]: lstrcpynA(0x0012FF68:[16], test, 32) [2864] [VulnTrace]: lstrcpynA(0x0012FF68:[16], test, 32) [2864] [VulnTrace]: lstrcpynA(0x0012FF68:[16], test, 32) ...
Here we can see the arguments being passed to lstrcpynA . The first parameter is the address and size of the destination buffer. The second parameter is the source buffer that will be copied into the destination. The third and last parameter is the maximum size that may be copied into the destination buffer. Notice the number located to the right of the first parameter: this number is the estimated size of the destination argument. It is calculated using some simple arithmetic with the frame pointer to determine in which stack frame the buffer is, as well as the distance of the variable from the base of the stack frame. If we supply more data than there is space between the variable address and the base of the frame pointer, we will begin to overwrite the saved EBP and EIP used by the previous frame.
Using VulnTrace
Now that we've implemented a basic tracing solution, let's try it out on an enterprise product. For my example, I'm going to use a popular ftp server for Windows. The directory names in the following example have been changed.
After installing the software package and starting the service, I inject our new VulnTrace.dll . I also start up DebugView and configure it to filter out every debug message that does not have the string VulnTrace . This is necessary due to the high degree of debug messages being delivered by other services.
I begin my session by making a telnet connection to the ftp server. As soon as I connect I see the following messages.
| Note | Several vulnerabilities were discovered in the following example. Taking into consideration that the vendor may have not been able to eliminate these issues from their product before this book was published, we replaced sensitive data with [deleted]. [2384] [VulnTrace]: lstrcpynA(0x00dc6e58:[0], Session, 256) [2384] [VulnTrace]: lstrcpyA(0x00dc9050:[0], 0) [2384] [VulnTrace]: lstrcpynA(0x00dc90f0:[0], 192.168.X.X, 256) [2384] [VulnTrace]: lstrcpynA(0x0152ebc4:[1624], 192.168.X.X, 256) [2384] [VulnTrace]: lstrcpyA(0x0152e93c:[260], ) [2384] [VulnTrace]: lstrcpynA(0x00dc91f8:[0], 192.168.X.X, 20) [2384] [VulnTrace]: lstrcpynA(0x00dc91f8:[0], 192.168.X.X, 20) [2384] [VulnTrace]: lstrcpyA(0x00dc930d:[0], C:\[deleted]) [2384] [VulnTrace]: lstrcpynA(0x00dc90f0:[0], [deleted], 256) [2384] [VulnTrace]: lstrcpyA(0x00dc930d:[0], C:\[deleted]) [2384] [VulnTrace]: lstrcpyA(0x00dd3810:[0], 27) [2384] [VulnTrace]: lstrcpyA(0x00dd3810:[0], 27) [2384] [VulnTrace]: lstrcpyA(0x0152e9cc:[292], C:\[deleted]) [2384] [VulnTrace]: lstrcpynA(0x00dd4ee0:[0], C:\[deleted]], 256) [2384] [VulnTrace]: lstrcpynA(0x00dd4ca0:[0], C:\[deleted]], 256) [2384] [VulnTrace]: lstrcpyA(0x00dd4da8:[0], C:\[deleted]\]) [2384] [VulnTrace]: lstrcpyA(0x0152ee20:[1048], C:\[deleted]\]) [2384] [VulnTrace]: lstrcpyA(0x0152daec:[4100], 220-[deleted]) [2384] [VulnTrace]: lstrcpyA(0x0152e8e4:[516], C:\[deleted]\) [2384] [VulnTrace]: lstrcpyA(0x0152a8a4:[4100], 220 [deleted]) |
If we look closely, we can see that the IP address is being recorded and passed around. This is most likely a logging feature or an inactivated access control system based on network addresses. All the paths referenced are server configuration files ”we can't control the data being passed into these routines. (We can't change the date either, although that would be a cool trick.)
My next step is to examine the authorization routines, so I send the string user test . (I previously set up an example account called test .)
[2384] [VulnTrace]: lstrcpynA(0x00dc7830:[0], test, 310) [2384] [VulnTrace]: lstrcpynA(0x00dd4920:[0], test, 256) [2384] [VulnTrace]: lstrcpynA(0x00dd4a40:[0], test, 81) [2384] [VulnTrace]: lstrcpynA(0x00dd4ab1:[0], C:\[deleted]\user\test, 257) [2384] [VulnTrace]: lstrcpynA(0x00dd4ca0:[0], C:\[deleted]\user\test, 256) [2384] [VulnTrace]: lstrcpyA(0x00dd4da8:[0], C:\[ deleted ]\user\test) [2384] [VulnTrace]: lstrcpyA(0x0152c190:[4100], 331 Password required
Things are getting a little more interesting now. We can see that a buffer containing our username is being copied into a buffer that isn't based on the stack. It would have been nice to include support for heap size estimation. We could go back and check this one manually, but let's move on and see whether we find anything else more promising . Now, we'll send our password using the ftp sequence pass test.
[2384] [VulnTrace]: lstrcpyA(0x00dd3810:[0], 27) [2384] [VulnTrace]: lstrcpyA(0x00dd3810:[0], 27) [2384] [VulnTrace]: lstrcpynA(0x0152e9e8:[288], test, 256) [2384] [VulnTrace]: lstrcpyA(0x00dc7830:[0], test) [2384] [VulnTrace]: lstrcpyA(0x0152ee00:[1028], C:\[deleted]) [2384] [VulnTrace]: lstrcpyA(0x0152e990:[1028], /user/test) [2384] [VulnTrace]: lstrcpyA(0x0152e138:[1024], test) [2384] [VulnTrace]: lstrcpynA(0x00dd4640:[0], test, 256) [2384] [VulnTrace]: lstrcpynA(0x00dd4760:[0], test, 81) [2384] [VulnTrace]: lstrcpynA(0x00dd47d1:[0], C:\[deleted]\user\test, 257) [2384] [VulnTrace]: lstrcpyA(0x0152ee00:[1028], C:\[ deleted ]\user\test) [2384] [VulnTrace]: lstrcpyA(0x0152e41c:[280], C:/[ deleted ]/user/test) [2384] [VulnTrace]: lstrcpynA(0x00dd4ca0:[0], C:/[deleted]/user/test, 256) [2384] [VulnTrace]: lstrcpyA(0x00dd4da8:[0], C:/[deleted]/user/test) [2384] [VulnTrace]: lstrcpynA(0x0152cdc9:[4071], [deleted] logon successful) [2384] [VulnTrace]: lstrcpyA(0x0152ecc8:[256], C:\[ deleted ]\user\test) [2384] [VulnTrace]: lstrcpyA(0x0152ee00:[1028], C:\[deleted]) [2384] [VulnTrace]: lstrcpyA(0x0152ebc0:[516], C:\[deleted]\welcome.txt) [2384] [VulnTrace]: lstrcpyA(0x0152ab80:[4100], 230 user logged in)
Now, we're seeing quite a few instances that may be exploitable. Unfortunately, the data that we can control is a valid username, and we may not be able to access these routines if we supply an invalid username. We'll simply record these instances and continue. Next, we'll check the virtual-to-physical mapping implementation. We'll try to change my current working directory to eeye2003 using the ftp command cwd eeye2003 .
[2384] [VulnTrace]: lstrcpyA(0x0152ea00:[2052], user/test) [2384] [VulnTrace]: lstrcpynA(0x0152e2d0:[1552], eeye2003, 1437) [2384] [VulnTrace]: lstrcpyA(0x00dc8b0c:[0], user/test/eeye2003) [2384] [VulnTrace]: lstrcpyA(0x0152ee00:[1028], C:\[deleted]) [2384] [VulnTrace]: lstrcpyA(0x0152dc54:[1024], test/eeye2003) [2384] [VulnTrace]: lstrcpynA(0x00dd4640:[0], test, 256) [2384] [VulnTrace]: lstrcpynA(0x00dd4760:[0], test, 81) [2384] [VulnTrace]: lstrcpynA(0x00dd47d1:[0], C:\[deleted]\user\test, 257) [2384] [VulnTrace]: lstrcpynA(0x00dd46c0:[0], eeye2003, 256) [2384] [VulnTrace]: lstrcpyA(0x0152ee00:[1028], C:\[ deleted ]\user\test\eeye2003) [2384] [VulnTrace]: lstrcpyA(0x0152b8cc:[4100], 550 eeye2003: folder doesn't exist
Now, we're in a good place. Several routines show vulnerable behavior. We also know we can control the data being passed through the various routines because the directory eeye2003 doesn't exist.
The largest of the static buffers is 2052 bytes, the smallest is 1024. We'll start from the smallest size and work our way up. So, our first buffer is 1024 bytes; this is the distance of the buffer from the base of the frame. If we supply 1032, we should be able to overwrite the saved EBP and saved EIP .
[2384] [VulnTrace]: lstrcpyA(0x0152ea00:[2052], user/test) [2384] [VulnTrace]: lstrcpynA(0x0152e2d0:[1552], eeye2003, 1437) [2384] [VulnTrace]: lstrcpyA(0x00dc8b0c:[0], user/test/eeye2003) [2384] [VulnTrace]: lstrcpyA(0x0152ee00:[1028], C:\[deleted]) [2384] [VulnTrace]: lstrcpyA(0x0152ee00:[1028], C:\ [deleted]\user\test/AAAAAAAAAAAAAAAAAAAAAAAAAAAAAAAAAAAAAAAAAAAAAAAAAAAA AAAAAAAAAAAAAAAAAAAAAAAAAAAAAAAAAAAAAAAAAAAAAAAAAAAAAAAAAAAAAAAAAAAAAAAA AAAAAAAAAAAAAAAAAAAAAAAAAAAAAAAAAAAAAAAAAAAAAAAAAAAAAAAAAAAAAAAAAAAAAAAA AAAAAAAAAAAAAAAAAAAAAAAAAAAAAAAAAAAAAAAAAAAAAAAAAAAAAAAAAAAA)
After that last message, VulnTrace stopped delivering messages to our DebugView. This is probably related to the fact that we just overwrote a chunk of the stack frame, the saved EBP and EIP of the previous function. So we loaded a debugger onto the server process and reproduced the steps, this time without VulnTrace loaded. Viola, we have an exploitable buffer overflow.
EAX = 00000000 EBX = 00DD3050 ECX = 41414141 EDX = 00463730 ESI = 00DD3050 EDI = 00130178 EIP = 41414141 ESP = 013DE060 EBP = 41414141 EFL = 00010212
As you can see, the saved EBP and EIP were overwritten as well as a local variable that was loaded into ECX . An attacker can modify that filename to contain a payload and a few addresses, and he can execution-control this vulnerable ftp server.
Now that we've demonstrated that this technology can be used to find vulnerabilities in simple software products, what can we do to improve our tracing utility so that we can find flaws in more secure software? This seems like a good time to cover some more advanced topics.
Advanced Techniques
In this section, we will cover a few of the more advanced vulnerability tracing technologies that can be implemented to improve vulnerability tracing technologies.
Fingerprint Systems
Statically linked functions do not export their addresses to external modules so we don't have a simple way to locate them. To locate statically linked functions, we'll need to build a machine-code analysis component that can identify vulnerable functions by a signature. The signature system we choose will directly affect our ability to properly identify the functions we want to monitor. We decided to choose a combination CRC 32-bit checksum and variable length signature system with a maximum signature length of 64 bytes.
The CRC checksum is simply a first-pass method to detect the function for which we're searching. We perform a CRC checksum on the first 16 bytes of the function we're analyzing. The deeper we go into a function, the higher the probability of failure due to the dynamic nature of the functions. By using a checksum first we achieve a small gain in performance because comparing CRC checksum s is significantly faster than a full-byte comparison against every signature in our database. For each function we analyze, we perform a CRC checksum on the first 16 bytes of the function. Because different buffers could possibly generate the same checksum , we will perform our direct comparison as a confirmation in order to verify that the target byte sequence is in fact the function for which we're searching. If our signature matches the byte sequence at the destination, then we can insert our hook and begin monitoring the targeted statically linked function.
We should also mention that our signature may fail if there are any direct memory references in the code sequence we're analyzing. We may also fail if a compiler modifies any part of a function when it is statically linked. Each of these scenarios is rare, but we want to prepare for the unexpected, so we add a small feature to our signature system, the special symbol * . Each instance of * in our signature represents a byte that should be ignored in the target byte sequence during comparison. This system allows us to create very flexible signatures that will improve the overall reliability of our signature system. Our signatures look like this:
Checksum Signature Function Name B10CCBF9 558BEC83EC208B45085689****558BEC83 vt_example
The CRC checksum is calculated from the first 16 bytes of the function. If we match a checksum on a function, then we'll compare our signature to the function code ”if they match, then we hook the function.
More Vulnerability Classes
Let's take a quick look at vulnerability tracing with some of the other classes of security bugs .
Integer Overflows
You can hook allocation and memory copy routines and examine the length arguments for abnormal sizes. This simple solution can be used in combination with fuzzing technologies to identify a variety of integer overflow class vulnerabilities.
Format Bugs
By examining arguments passed to the various formatting functions, such as snprintf , you can identify a variety of format bug class vulnerabilities.
Other Classes
Directory Traversal, SQL Injection, XSS, and many other vulnerability classes can be detected by simply monitoring the functions that deal with their data.
EAN: 2147483647
Pages: 198