Examples of Other Metrics Charts
|
There are numerous metrics charts that can be developed to support the various needs of the ISSO. The following are examples of some of those charts.[3]
The ISSO may also use this information when budget cuts are required. The chart can be shown to management and modified to show what would happen if the staff were cut one person, two people, etc. In other words, the average users' initial access to systems in terms of turnaround time would increase. Management may or may not want to live with those consequences. The cost can be quantified by taking the average hourly wage of the employee, identifying how much productivity time is lost with access coming within 1 business day, and comparing that to time lost if access, because an access control person has been laid off, takes 2 business days.
For example, an employee earns $15 an hour. The employee shows up at the desk of an access controller at the start of the business day, 8 A.M. That employee is authorized system access by 8 A.M. the next day. This loss of at least 8 hours of productivity at $15 an hour would be the normal cost of the InfoSec function of access control, or $120 per employee. However, if the access were not authorized until the day after, the costs per employee would be $240.
The chart can show the ISSO where staff cuts can be made and still meet the expected goals. The ISSO can also use this information when deciding to reallocate resources (transfer a person) to another function where the goals are not being met, and where the fastest way to meet the goal is to add head count. A word of caution here—adding or decreasing head count is usually considered a fast, simple solution. However, it is not always the answer.
Sometimes when the numbers look right the decision is still wrong!—Ken Blanchard and Norman Vincent Peale
Many project leaders and ISSOs have found over the years that projects and level-of-effort problems are not always solved by assigning more bodies to solving the problem. One should first look at the process and at systemic problems. This is usually a more cost-effective approach to solving these types of problems. For example, using the example of the newly hired employee getting first-time system access, suppose a way was found to cut that time down to 1 hour. The costs saving would be from the normal $120 to $15, or a saving of $105 per new employee. Such charts can be used for management briefings and will show specifically how the ISSO and staff are lowering InfoSec costs, at least for that particular InfoSec function.
Samples of Noncompliance Inquiry Charts
Examples of this kind of chart are given in Figures 9.5 through 9.7.[4] These charts typically show infractions by individual departments (Figure 9.7). That means each department's vice president will internally compare his or her department against the others, thereby causing a covert competition to begin. Vice presidents do not want their departments to look bad, and because of their competitive nature, the vice-presidents will push to have a "zero" for each month. Each will want to know exactly what the individual NCIs were for. The ISSO must be prepared to answer them—using individual charts per department. Is this a lot of work? Yes. However, the benefits are that each department's vice-president will be pushing to have zero noncompliance inquiries conducted, which means the vice presidents will be overt supporters of the CIAPP and will push their staff to follow the CIAPP.
It also often leads to the ISSO joining the staff meetings of the departments' vice presidents and presenting the individual analyses of each department and sub-department. The ISSO should also then be in a position to explain what can be done to minimize these infractions, as well as minimize the loss of productivity, and thus dollars, caused by each infraction. Showing the cost in lost productivity in hours per noncompliance inquiry will have a major impact on the staff. This can then also be linked to losses in terms of budget using an average IWC salary or hourly wage, which can often be gotten from the Finance or Human Relations staff.
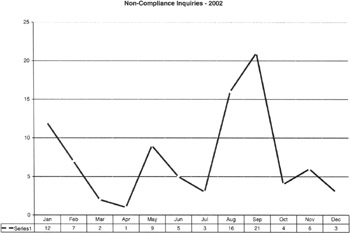
Figure 9.5: The total number of noncompliance inquiries conducted by month for the year 2002.
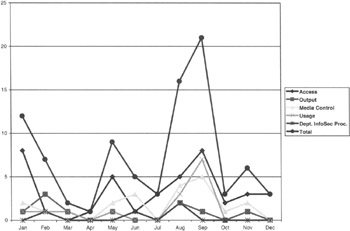
Figure 9.6: The total number of noncompliance inquiries conducted by type for the year 2002.
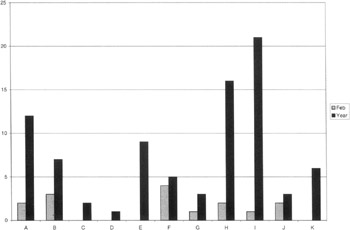
Figure 9.7: The total number of noncompliance inquiries conducted by each IWC department for the month of February, and the total of all departments for the period January and February 2002.
The ISSO should also take to these briefings one or more of the InfoSec staff who have some responsibility for the information presented. This lets the staff members see how their work affects IWC department personnel. It also helps them become part of the entire process of working the InfoSec issues—and it is an opportunity for the ISSO to show confidence and support for InfoSec staff. By no means should they be used as a scapegoat or allowed to be the target of abuse by managers defensively rationalizing that a noncompliance inquiry was groundless, should not have been conducted, or the like. The ISSO should at all times take the blame and give the credit to InfoSec staff members. Furthermore, the ISSO must keep the focus of the meeting on the material being briefed and must discuss the numbers. The meeting should never be allowed to become a "finger-pointing" and inquiring report critique. This is not often easy to do as the department managers try to defend themselves. The meeting objective and ground rules for discussion should be stated in advance by the ISSO if the vice president does not so state.
The primary use of a chart like the one in Figure 9.8 is for the ISSO to understand the workload of one of the InfoSec functions. By looking at the number of inquiries opened, closed, and pending per month, the ISSO can, for example, determine whether the staff member conducting the inquiry requires additional staff support. The turnaround time of these inquiries is important—the sooner an inquiry is completed, the sooner, the employee's manager, in concert with IWC Human relations staff, can take whatever action is deemed appropriate. This is crucial if the person may be subject to termination or if the employee's system access had been suspended pending completion of the inquiry and the adjudication process.
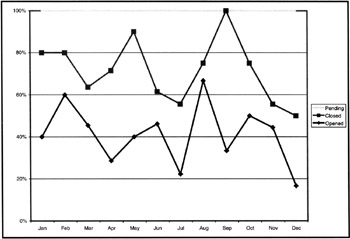
Figure 9.8: The total number of noncompliance inquiries opened per month, closed per month, and pending per month.
As with all metrics charts, a decision must also be made whether to collect the data monthly, quarterly, semiannually, annually, or somewhere in between. The time period will depend on several factors. These include, but are not limited to:
-
What they will be used for, such as monthly or annual executive briefings;
-
Budget justifications;
-
InfoSec staff functions resource allocations; and
-
The objectives of each chart.
A subchart of this chart may be the average time spent, in hours, per type of inquiry (Figure 9.9). Once the time elements are known, they can be equated to productivity gains and losses, as well as budget, such as money, equipment, and staff.
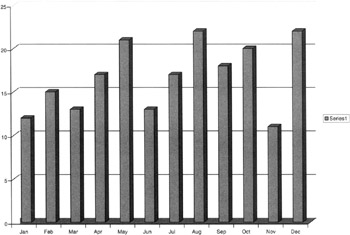
Figure 9.9: The average time spent in hours per noncompliance inquiry.
InfoSec Tests and Evaluations
The ISSO decides to establish a process that will provide guidelines on the need, establishment, and implementation of metrics charts. The ISSO uses an InfoSec function to develop the process—the methodology—with the following results:
-
IWC InfoSec will conduct security tests and evaluations (ST&E) as prescribed by IWC InfoSec policies and procedures.
-
Results of IWC InfoSec ST&E will be charted.
-
Each chart will be evaluated to determine whether a pattern/trend exists.
-
Patterns/trends will be evaluated to determine how effectively a function is being performed.
-
Results and recommendations will be presented, in accordance with InfoSec policies and procedures, to the applicable managers.
Another InfoSec function that provides opportunities for using metrics management techniques is the function of InfoSec ST&E. The charts in Figures 9.10 through 9.12 are samples of metrics management charts that may be of use to an ISSO.[5]
Figure 9.10 is a useful chart in that it shows an increase in workload over time that can be compared with staffing for that function over time. The ISSO may consider a reallocation of staff because of the increased workload. Also to be considered is whether or not to change the ST&E process. One consideration is to conduct fewer ST&Es. If one does that, it would be important to monitor the number of noncompliance inquiries, as they may go up. For example, fewer ST&Es may result in increased systems vulnerabilities, which may in turn lead to more successful attacks, and thus to more noncompliance inquiries. Another factor the ISSO may consider is doing more ST&Es using automated InfoSec software to replace some currently manual testing.
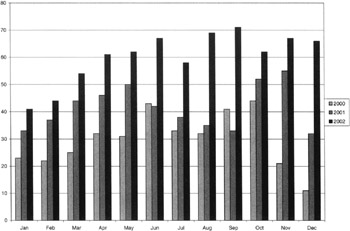
Figure 9.10: The total number of ST&Es conducted over the past 3 years.
One can also consider providing training to IWC department staff so they can do their own ST&Es and provide reports to the ISSO. This is usually not a good idea, as the objectivity of the testing may be questionable. For example, they may find vulnerabilities but not report them, because they do not want to incur the costs in time and budget to mitigate the risks identified by these vulnerabilities. In addition, as far the IWC as a whole is concerned, one is only passing on the costs in terms of allocation of resources to conduct the ST&Es to another department and not decreasing overall IWC CIAPP costs.
Remember that IWC is a global corporation with plants and offices on three continents. Since the ISSO has overall CIAPP and InfoSec functional responsibility for all locations, a process must be put in place for metrics management at all locations. The CIAPP-InfoSec functional leads at all the locations would provide the statistics and charts for their locations (Figure 9.11).
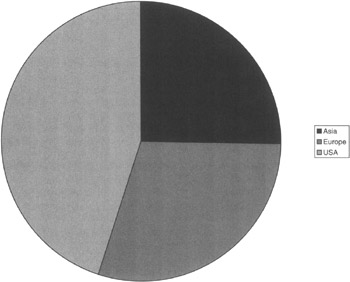
Figure 9.11: The number of ST&Es conducted per location in 2002.
These statistics would be indicators in establishing InfoSec functional resource allocations based on the "worst" locations (Figure 9.12).
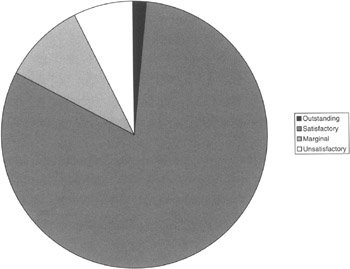
Figure 9.12: The ratings (Outstanding, Satisfactory, Marginal, Unsatisfactory) of ST&Es conducted within the corporate office in the year 2002.
The issue that will often come up when designing charts is what type of charts to use—bar, line, pie, etc. The choice should be to use the format that meets the chart's objective in the most concise and clear way.
An ISSO sometimes comes across numbers that are out of balance with each other, e.g. 135 satisfactory ST&E ratings, 13 marginal. If the chart chosen were a line chart or a bar chart, the smaller number would be so dwarfed as to be unreadable. In this case, the pie chart may be the solution.
The other solution may be to label each point in the chart with its number. For example, the bar or line designating 13 marginal ratings would have the number 13 over that point in the chart. This may give the perception that the marginal ratings were somewhat meaningless. However, as an ISSO, you are aware that is not the case, and in fact, indicates increased vulnerabilities to successful attack on those systems. The pie chart, on the other hand, shows that the number is small, but it at least appears large on the graph. The audience will see that number as being at least more significant than the same number shown on a line or bar chart.
InfoSec Education and Awareness Training
The CIAPP's InfoSec Education and Awareness Training Program (EATP) is one of the major baselines of the CIAPP. It follows that it is an integral part of the ISSO's InfoSec organization. It doesn't matter whether briefings, training and such are given by an InfoSec staff member, the IWC Training Office, the Director of Security's security training personnel, Human Resources new-hire briefings, or a combination of any of these organizations. It is a CIAPP, and therefore an InfoSec cost, and it should be metrics-managed.
For the purposes of this chapter on metrics management, let us assume that one of the ISSO's InfoSec staff is responsible for the EATP. At least two major metrics charts should be maintained (Figures 9.13 and 9.14).
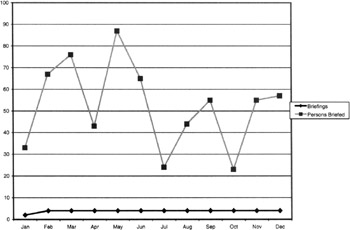
Figure 9.13: The number of briefings given and the number of personnel per briefing.
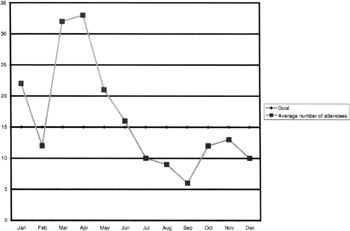
Figure 9.14: The average number of attendees per SEATP briefing measured against the goal of at least 15 personnel per briefing.
Let's assume that to be somewhat cost-effective, the goal is to have at least 15 employees on average attend each briefing. That being the case, this metrics chart or another like it would show not only the number of briefings and the total attendees, but also the average number of attendees per briefing. In addition, a straight line could be included at 15 so that the average attendees per briefing can easily be compared against the goal of 15 employees per briefing. Lost? OK, let make it easy. See Figure 9.14.
If the goal was not being reached, as the ISSO, you might want to discuss the matter with your InfoSec leader for the EATP. Certainly if the goal is not being met, you can't and obviously shouldn't ignore it. There is nothing worse than setting a goal, metrics managing to attain that goal, and then ignoring it when it is not being met. Furthermore, as an ISSO you shouldn't just wait until the end of the year to attempt to correct the matter in discussion with your EATP lead, and then zap that person in his or her year-end performance evaluation.
Let us assume that employees must attend an annual briefing relative to the CIAPP and their duties and responsibilities. Assume that they prepare to attend the briefing and walk to the briefing room, and that it takes 15 minutes. They attend a 1-hour briefing and return to their place of work for a total time of 90 minutes. At an average employment rate of $15 per hour, each employee's time (and lost productivity, since they are not performing the work for which they were hired) for the annual briefing is $22.50. Let's also suppose that IWC employs 100,000 people worldwide and all of them must attend the annual briefing. That means that the annual briefing program, excluding the time the InfoSec specialist takes in preparing the updated material each year and other expenses, costs an astounding $2,250,000!
Figure 9.15 shows one type of category; however, there are others. For example, the ISSO may want to track the number of personnel briefed by such categories as InfoSec systems custodians, general users, subcontractors, Asian offices, European office, and U.S. offices.
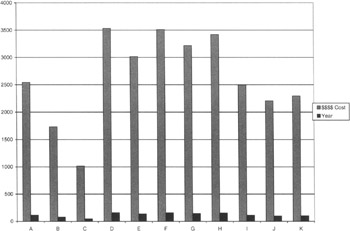
Figure 9.15: The number of personnel briefed by IWC departments and the costs of the briefings in each department, such as lost productivity equated to dollars of time.
One can argue that the briefings are necessary, they save money in the long run because valuable IWC is protected, and all that. However, that does not change the fact that this is a rather costly program. In fact, there is no indication that the cost-benefits have ever been validated. Yet, every ISSO knows that employee awareness of the threats, vulnerabilities, and risks to information and information systems is an absolute necessity. So, what can be done to lower the cost of such a program?
Using the project team approach the ISSO should establish a project team to look at the costs, benefits, and risks of not having an annual briefing and other methods for providing awareness to employees. Possibly the use of e-mails, online briefings, and other electronic means could eliminate the need for the employees to physically attend a briefing. Possibly briefings could be eliminated or online bulletins used.
Cost Avoidance Metrics
As an ISSO, you may want to use the metrics management approach to be able to quantify the savings of some of your decisions. For example, when analyzing your budget and expenditures, you note that a major budget item is travel costs for your staff. This is logical, because staff, as well as you, must travel to the various IWC offices to conduct InfoSec tests and evaluations.
Again, using the project management approach, you lead a project team of yourself, staff members, and a representative from the Contract Office and Travel Office. Your goal is to find ways to cut travel costs while still meeting all the CIAPP and your charter responsibilities. A representative from the Contract Office will advise the project team on contractual obligations and way in which they can be met with less travel, but without violating the terms of the contracts. The Travel Office will give advice on ways to cut travel costs. For example, because many trips are known well in advance, flights and hotels can also be booked in advance.
The project team came up with some valid changes in the processes the InfoSec staff uses as part of their travel budget. Figure 9.16 was developed to track the savings based on the process changes.
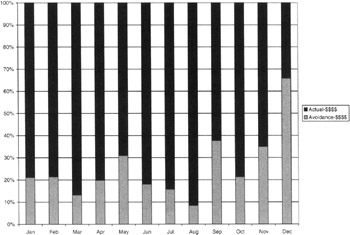
Figure 9.16: The costs and cost avoidance of InfoSec staff travel.
Metrics Management and Downsizing
All ISSOs at one time or another in their careers face the need to downsize—that is, lay off, fire, or terminate—InfoSec staff. However, if you are operating at peak efficiency and have not built any excess staff into meeting your charter responsibilities, you may be able to make a case for not terminating staff, or terminating fewer personnel.
Many managers, and ISSOs are no exception, tend to forget that they are hired to do a job, and that job is not to build an "empire" or bureaucracy. The key to success is getting the job done efficiently and effectively—as we said before, good and cheap. Besides, the more staff members and the larger the budget you have, the more people problems you will have and the harder the financial people will try to take some of your budget. So you are constantly battling to maintain your large budget.
If, on the other hand, you have a small staff and a smaller budget, you have a better chance of protecting what you have, because it is the minimum needed to get the job done. That approach coupled with metrics management techniques and periodic briefings to executive management will help you continue to get the job done as you deem appropriate, even though other organizations are losing staff.
Let's look at some figures showing various ways of presenting information based on metrics management's data collection efforts:
The LOE versus project support chart in Figure 9.17 clearly shows that the InfoSec organization has been supporting the projects of other IWC departments and that the workload is not "nice-to-have" projects. These are projects that require the support of the ISSO and InfoSec staff. It also shows that the ISSO and staff are an integral part of major IWC projects and are functioning as part of their service and support duties.
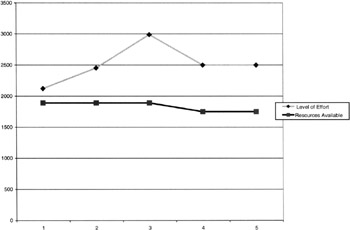
Figure 9.17: A 5-year period tracking the level of effort in hours of work of the InfoSec staff per year, per individual, compared to the hours of work that must be accomplished to support the IWC departments.
Taking this chart as an example, similar charts can then be developed using the same template but showing the workload per function versus budgeted hours for each function, such as SEATP and ST&E.
Another chart that is important for briefing management is one that shows the LOE versus the hours available for the InfoSec staff (Figure 9.18). The difference between LOE and time available can be shown to be part of a briefing on work backlog or used to show the difference is overtime being worked. A subchart may show details on the amount of backlog and its impact on the cost of doing business. It can also show the overtime costs being paid, and perhaps a comparison of that cost with the cost of hiring one or more additional staff. Seeing this comparison would help in making decisions as to which is cheaper, paying overtime or hiring more staff.
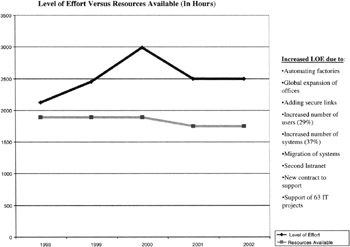
Figure 9.18: The LOE versus the hours available to do the work.
These charts must also be accompanied by others showing productivity and drivers of workload, as in some of the charts shown earlier. This is necessary because management will ask why you must do the things you do, and why must you do them in the way you are doing them. This quest for productivity and efficiency gains will be a constant chore for the ISSO. It is a challenge, but one that can be supported by metrics charts.
Layoffs are a fact of life in business, and metrics charts can help the ISSO justify head count and work, as shown by some of these charts. Other charts may also help, such as that shown in Figure 9.19. The chart can show measurement in terms of head count or hours that are equivalent to head count.
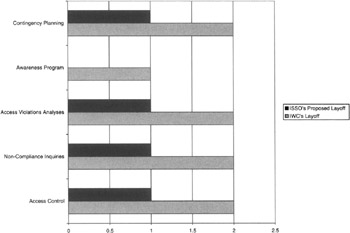
Figure 9.19: Comparison of IWC executive management requested layoff versus a counterproposal by the ISSO.
Generally, when management decides to cut costs, they lay off employees as the easiest method. They also usually direct each manager to cut a certain percentage of staff, say, 20%. However, although this may be the easiest way, it is not the best way; sometimes it would be cheaper to keep some of the staff, because their loss causes delays costing millions of dollars worth of production, sales, etc. As we all know, executive management often takes a short-term, "what's in it for me now" approach to managing their parts of the business.
Metrics management can help the ISSO plead the case to not cut 20% of staff. One word of caution: The ISSO should do this objectively and based on providing effective and efficient service and support to the IWC departments. It should never, ever be based on keeping a large staff and bureaucracy for the sake of status, power, ego, or other nonbusiness reasons.
Along with the chart shown in Figure 9.19, the ISSO would include information relative to the impact of both IWC's directed layoff numbers and those of the ISSO. This must be objectively done based on a business rationale. This information would include the following, identified as increasing the level of risks to information and information systems:
-
Contingency planning: Contingency, emergency, and disaster recovery testing and plan updates will be delayed. The result will be anything from no impact to not being able to effectively and efficiently deal with an emergency.
-
Awareness program: Employees may not be aware of their responsibilities, thus leaving the systems open to potential attack or an increase in the potential of the loss of sensitive information.
-
Access violations analyses: There will be delays of between 48 and 72 hours in the analyses of audit records. Thus, an attack against IWC systems would not be known for at least 48–72 hours. During that period, information could be stolen. However, something like a denial of service attack would be known when it was successful. The opportunity to identify the initial attempts at these attacks over a period of time would be lost, and with it the chance to mount defenses before the attacks were successful. The result will be systems, possibly production systems, that are down for an unknown period of time.
-
Noncompliance inquiries: The average time it would take to complete an inquiry would increase by more than 2 weeks. Thus, no action to adjudicate the alleged infraction would be possible until the report was delivered to management. Furthermore, the alleged infraction may have called for the revocation of system privileges of the employee or employees who are the subject of the inquiry. Thus, their ability to be productive employees during that time would be negated.
-
Access control: It is assumed that the number of new employees hired would be drastically reduced, and that could mitigate some of the level of effort expended by the access controllers. However, employees requiring changes in privilege would have those access changes delayed an additional 48–72 hours from the present average of 8–12 hours. This may adversely affect their productivity. To allow departments to do their own employees' privilege changes was evaluated under a previous project and found to not be realistic: The information to which the employees needed access did not belong to that department; most often it belonged to another information owner. These information owners did not want others to access their information without their approval. In addition, this change would just a transferring of costs and would not save IWC any additional resources.
The foregoing is a small example of how metric management techniques can be used when the need for budget cuts occurs. The example provides some insight into how metric management techniques help mitigate the risks of budget and staff downsizing when such downsizing will hurt the CIAPP and IWC. Metric management techniques can help the ISSO make a case to executive management. Furthermore, if the ISSO, supported by the metric management approach, has been periodically briefing management of the CIAPP and ISSO's projects and level of effort, the ISSO will have gained the confidence of management as a reliable manager who gets the job done as efficiently and effectively as possible.
[3]The reader should try developing other metrics charts and also, using the examples, determine how they could be used to support ISSO requirements; to determine successes and failures of the CIAPP; and to support briefings.
[4]Although these and all charts are published in this book in black and white, it is assumed that the ISSO's charts would be in color.
[5]For those readers trying to match numbers between charts and subcharts, you might as well know now that the numbers for each chart are arbitrarily assigned and do not reflect any consistency throughout. They are given as samples only. If you are looking for "real" numbers, you are missing the point of this chapter—the process and thinking behind metrics management of InfoSec functions.
|
EAN: 2147483647
Pages: 204