SQL Server Profiler
|
|
SQL Server Profiler is a powerful tool in your SQL Server arsenal, because it allows you to trace nearly any SQL Server activity. It's the perfect tool when you're debugging why your program isn't working the way it's designed or you're trying to tune performance.
To create a new trace, open Profiler from the Microsoft SQL Server program group and select File | New | Trace. Select the server name you want to monitor. Then select one of the predefined templates from the Template Name drop-down box.
As you can see in Figure 7-5, you can also output the results of the trace to an output file for later review. Even if you decide not to save the file here, you'll have another opportunity later. The size of these trace files can grow to 1GB. In this tab, you can configure the file to automatically roll over when it reaches a specified limit.
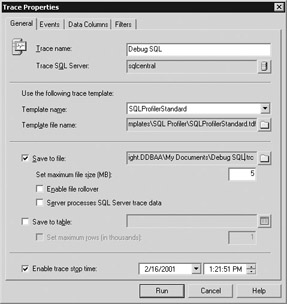
Figure 7-5: Creating a new trace
| Note | You must be a SysAdmin to run or create a trace. |
You can save trace results to a table, but I highly recommend against this, because Profiler is already network and database intensive. The process creates lots of rows quickly and may present added weight on the server. If you want to end up with a table, save it into the table later, after the trace has completed.
| Tip | The last option I like to set when I'm capturing data over a long period of time is the Enable Trace Stop Time option. This allows you to start the trace, then have it automatically stop whenever the limit is reached. |
Under the Events tab in the Trace Properties screen, you can specify the type of events you'd like to trap (see Figure 7-6). Normally, the default options are appropriate. However, if you're trying to debug a specific problem, you should trap the appropriate events (for example, you can detect when database growth occurs).
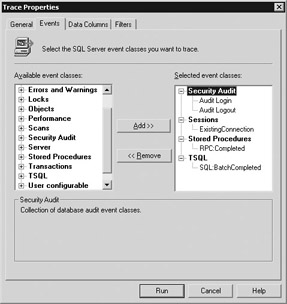
Figure 7-6: Specifying the events to trap
Use the Data Columns tab to specify the columns you'd like to capture data for when an event is raised (see Figure 7-7). The defaults are fine in most situations, unless you're performing some specialized debugging.
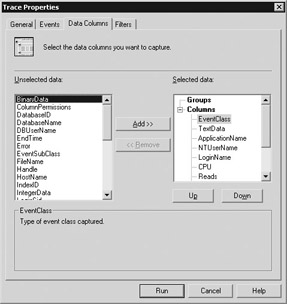
Figure 7-7: Specifying the columns to capture
| Caution | Be very careful in the Events and Data Columns tabs. The more data you trap, the slower your system operates. If this is not a problem, you can select all the columns and events and then filter it later. |
The Filters tab allows you to take out some of the garbage the trace may find. For example, if you have SQL Server Agent turned on, you may not want to see the constant calls it makes. You can select the Exclude System IDs option to take out some of the internal noise. You can also filter which database names you like to track or specify a given user. When trying to debug a performance problem I like to filter on and watch the following:
-
CPU Greater than a given number. This number can be relative based on how bad your performance problem is. Generally speaking, anything greater than 100 milliseconds is probably worth noting.
-
Logins/Logouts This is not a filter, but rather an event. If you see tons of logins and few logouts, your application may not be explicitly closing connections.
Even after you've completed the trace, you can save its data by choosing File | Save or File | Save As. Using Save As provides options to save the information to a SQL Server table, trace file, or as a template. You can later open the traces from the same locations under the File menu.
I like to save the trace out to a table after it's complete so I can manipulate and perform advanced queries against the results. For example, you may want to find out the top ten worst performing queries by sorting on the CPU column in a descending order.
|
|