Fuzzy Grouping
In the previous section, you learned about situations where bad data creep into your dimension tables. The blame was placed on the "lazy-add" ETL processes that add data to dimension tables to avoid rejecting rows when there are no natural key matches. Processes like these are responsible for state abbreviations like "XX" and entries that look to the human eye like duplicates but are stored as two separate entries. The occupation titles "X-Ray Tech" and "XRay Tech" are good examples of duplicates that humans can see but computers have a harder time with.
The Fuzzy Grouping transformation can look through a list of similar text and group the results using the same logic as the Fuzzy Lookup. You can use these groupings in a transformation table to clean up source and destination data or to crunch fact tables into more meaningful results without altering the underlying data. The Fuzzy Group transformation also expects an input stream of text. It also requires a connection to an OLE DB data source because it creates in that source a set of structures to use during the analysis of the input stream.
The Fuzzy Lookup Editor has three configuration tabs:
-
Connection Manager: This tab sets the OLE DB connection that the transform will use to write the storage tables that it needs.
-
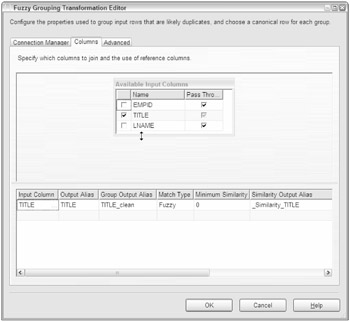
Columns: This tab displays the Available Input Columns and allows the selection of any or all input columns for fuzzy grouping analysis. See Figure 6-26 for a completed Columns tab.
Each column selected will be analyzed and grouped into logical matches resulting in a new column representing that group match for each data row. Each column can also be selected for Pass-Through — meaning the data is not analyzed but is available in the output stream. You can choose the names of any of the output columns: Group Output Alias, Output Alias, Clean Match, and Similarity Alias score column.
The minimum similarity evaluation is available at the column level if you select more than one column.
The numerals option (which is not visible in Figure 6-26 but can be found by scrolling to the right) allows configuration of the significance of numbers in the input stream when grouping text logically. The options are to consider leading, trailing, leading and trailing, or neither leading nor trailing numbers significant. This option would need to be considered when comparing address or similar types of information.
Comparison flags are the same options to ignore or pay attention to case, kana type, nonspacing characters, character width, symbols, and punctuation.
-
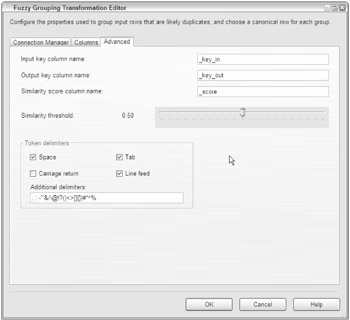
Advanced: This tab contains the settings controlling the fuzzy logic algorithms that assign groupings to text in the input stream. You can set the names of the three additional fields that will be added automatically to the output of this transform. These fields are named "_key_out," "_key_in," and "_score" by default. A slider controls the Similarity threshold. A recommendation for this transform is to start this setting at 0.5 while experimenting and then move it up or down as you review the results. The token delimiters can also be set if, for example, you don't want the comparison process to break incoming strings up by "." or spaces. The default for this setting is all common delimiters. See Figure 6-27 for a completed Advanced tab.

Figure 6-26

Figure 6-27
Suppose you are tasked with creating a brand-new occupations table using the employee occupations text file you imported in the Fuzzy Lookup example. Using only this data, create a new employee occupations table with occupation titles that can serve as natural keys and that best represent this sample. Use the Fuzzy Grouping transform to develop the groupings for the dimension table.
-
Create a new SSIS project named Fuzzy Grouping Example. Drop a Data Flow task on the Control Flow design surface and click on the Data Flow tab.
-
Add a Flat File Connection to the Connection Manager. Name it "Employee Data." Set the file name to "c:\import\empdata.txt." (Use the empdata.txt file from the Fuzzy Lookup example.) Set the Format property to Ragged Right. Set the option to pull the column names from the first data row. Click on the Columns tab and set the columns to break at positions 5 and 28. Click on the Advanced tab and set the OuputColumnWidth property for the TITLE field to 50. Save the connection.
-
Add a Flat File Source to the Data Flow surface and configure to use the Employee Data connection. Add an OLE DB Destination.
-
Add a Fuzzy Grouping transform task to the Data Flow design surface. Connect the output of the Flat File source to the Fuzzy Lookup and the output of the Fuzzy Lookup to the OLE DB Destination.
-
Open the Fuzzy Grouping Editor and set the OLE DB Connection Manager to the AdventureWorks connection.
-
In the Columns tab, select the Title column in the Available Input Columns. Accept the other defaults. Figure 6-26 is an example of a completed Columns tab for this example.
-
In the Advanced tab, set the Similarity threshold to .50. This will be your starting point for similarity comparisons.
-
Add an OLE DB Destination to the Data Flow design surface. Configure the destination to use the AdventureWorks database or database of your choice. For the Name of Table or View, click the New button. Change the name of the table in the CREATE table statement to [FuzzyGrouping]. Click on the Mapping tab to complete the task and save it.
-
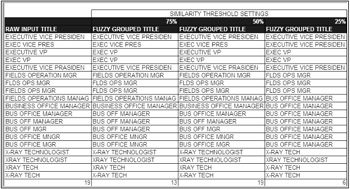
Add a Data Viewer in the pipe between the Fuzzy Grouping transform and the OLE DB Destination. Set the type to grid so that you can review the data at this point. Run the package. The output shown at multiple similarity thresholds would look similar to Figure 6-28.

Figure 6-28
Now you can look at these results and see more logical groupings and a few issues even at the lowest level of similarity. The title of "X-Ray Tech" is similar to the title "Xray Technologist." The title "Executive Vice Presiden" isn't really a complete title, and really should be grouped with "Exec VP." But this is pretty good for about five minutes of work.
To build a dimension table from this output, look at the two fields in the Data View named "_key_in" and "_key_out." If these two values match, then the grouped value is the "best" representative candidate for the natural key in a dimension table. Separate the rows in the stream using a Conditional Split transform where these two values match, and use an OLE Command transform to insert the values in the dimension table. Remember that the more data, the better the grouping.
The output of the Fuzzy Grouping transform is also a good basis for a translation table in your ETL processes. By saving both the original value and the Fuzzy Grouping value — with a little subject matter expert editing — you can use a Lookup transform and this table to provide much-improved foreign key lookup results. You'll be able to improve on this idea with the Slowly Changing Dimension transform later in the chapter.
EAN: 2147483647
Pages: 182