Pipeline Performance Monitoring
In the last chapter, one of the things you looked at was the built-in Pipeline logging functionality and how it could help you understand what Integration Services was doing behind the scenes when running a package with one or more Data Flows. Another tool available to Integration Services is the Windows operating system tool called Performance Monitor (PerfMon for short), which is available to local administrators in the machine's Administrative Tools. When Integration Services is installed on a machine, a set of counters is added that allows the tracking of the Data Flow's performance.
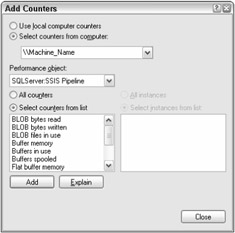
As Figure 11-20 shows, the Pipeline counters can be used when selecting the SQLServer:SSIS Pipeline object.

Figure 11-20
The following counters are available in the SQLServer:SSIS Pipeline object within PerfMon. Descriptions of these counters are provided below.
-
BLOB bytes read
-
BLOB bytes written
-
BLOB files in use
-
Buffer memory
-
Buffers in use
-
Buffers spooled
-
Flat buffer memory
-
Flat buffers in use
-
Private buffers in use
-
Rows read
-
Rows written
The BLOB counters help identify the volume of the BLOB data types flowing through the Data Flow. Since handling large binary columns can be a huge drain on the available memory, understanding how your Data Flow is handling BLOB data types becomes important. Remember that BLOB data can be introduced to the Data Flow not only by Source adapters but also by the Import (and Export) Column transformations.
Since buffers are the mechanism that the Data Flow uses to process all data, the buffer-related counters provide the most valuable information to seeing how much and where memory is being used in the Data Flow. The Buffer Memory and Buffers in Use counters are the high-level counters that provide totals for the server, both memory use and total buffer count. Essentially, the Buffer Memory counter shows the total memory being used by Integration Services and can be compared with the amount of available system memory to know if Integration Services processing is bottlenecked by the available physical memory. Furthermore, the Buffers Spooled counter provides even more indication of resource limitations on your server. It shows the number of buffers temporarily written to disk if enough system memory is not available. Anything greater than zero shows that your Data Flow is having to utilize temporary disk storage to accomplish its work, which comes with an IO impact and overhead.
In regard to the buffer details, two types of buffers exist, flat and private. Flat buffers are the primary Data Flow buffers used when a Source adapter sends data into the Data Flow. Synchronous transformation outputs pass the flat buffers to the next component, and asynchronous outputs use reprovisioned or new flat buffers to be passed to the next transformation. On the other hand, some transformations require different buffers, called private buffers, which are received from upstream transformations or passed on to downstream transformations. Three primary examples of private buffer use are found in the Aggregate, Sort, and Lookup transformations, which use private buffers to cache data that is used for calculations and matching. These transformations still use flat buffers for data being received and passed, but they also use private buffers to manage and cache supplemental data used in the transformation. The flat and private buffer counters show the breakdown of these usages and help identify where buffers are being used and to what extent.
The last counters in the Pipeline counters list simply show the number of rows handled in the Data Flow, whether Rows Read or Rows Written. These numbers are aggregates of the rows processed since the counters were started.
When reviewing these counters, remember that they are an aggregate of all the Integration Services packages and embedded Data Flows running on your server. If you are attempting to isolate performance impacts of specific Data Flows or packages, run these by themselves and capture the Pipeline counters for review.
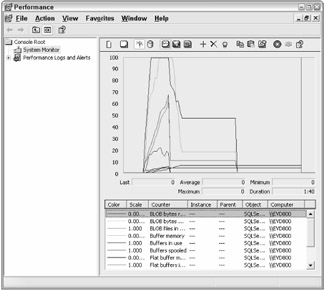
The Pipeline counters can be tracked in the UI of Performance Monitor in real time or captured at a recurring interval for later evaluation. Figure 11-21 shows the Pipeline counters tracked during the execution of Figure 11-11.

Figure 11-21
Notice that the buffer usage scales up and then drops and that the plateau lines occur during the database commit process when Integration Services has completed its processes and is waiting on the database to commit the insert transaction. When the package is complete, the buffers are released and the buffer counters drop to zero, while the row count buffers remain stable since they represent the aggregate rows processed since the PerfMon was started.
EAN: 2147483647
Pages: 182