Tuning Process
There is always room for tuning, but it is very important that you have enough data to start with. Therefore, you need to take a baseline of the system's performance and compare against that baseline so that you know where to start. Chapter 13 has details on getting the baseline. Just because a process is slow doesn't mean that you have to start tuning SQL statements. There are many basic things you need to do first, such as configuring the SQL Server database, and making sure tempdb and the log files are on their own drives. It is very important to get the server configuration correct. See Chapters 11 and 12 for details about configuring your server and database for optimal performance. There is also a whitepaper on tempdb that we recommend you read as well: http://download.microsoft.com/download/4/f/8//WorkingWithTempDB.doc.
Don't overlook the obvious. For example, suppose you notice that performance is suddenly pretty bad on your server. If you have done a baseline and that doesn't show much change in performance, then it is unlikely that the sudden performance change was caused by an application in most cases (unless there is a new patch for your application that caused some performance changes). In this case, look at your server configuration and see if that changed recently. Sometimes you merely run out of disk space, especially on drives where your page files reside, and that will bring the server to its knees.
| Note | We assume here that you already know what clustered and nonclustered indexes are, including how they work and how they are physically structured, and what a heap is. |
Database I/O Information
Normally, an enterprise application has one or two databases residing on the server, in which case you would know that you have to look into queries against those databases. However, if you have many databases on the server and you are not sure which database is causing a lot of I/O and may be responsible for a performance issue, you have to look at the I/O activities against the database and find out which causes the most I/O and stalls on I/O. In SQL Server 2005, the DMF called sys.dm_io_virtual_file_stats comes in handy for this purpose.
You can use the following script to find out this information. The script is provided in the subfolder DatabaseIO in the sample folder for this chapter, which you can download from this book's Web site at www.wrox.com.
-- Database IO analysis. WITH IOFORDATABASE AS ( SELECT DB_NAME(VFS.database_id) AS DatabaseName ,CASE WHEN smf.type = 1 THEN 'LOG_FILE' ELSE 'DATA_FILE' END AS DatabaseFile_Type ,SUM(VFS.num_of_bytes_written) AS IO_Write ,SUM(VFS.num_of_bytes_read) AS IO_Read ,SUM(VFS.num_of_bytes_read + VFS.num_of_bytes_written) AS Total_IO ,SUM(VFS.io_stall) AS IO_STALL FROM sys.dm_io_virtual_file_stats(NULL, NULL) AS VFS JOIN sys.master_files AS smf ON VFS.database_id = smf.database_id AND VFS.file_id = smf.file_id GROUP BY DB_NAME(VFS.database_id) ,smf.type ) SELECT ROW_NUMBER() OVER(ORDER BY io_stall DESC) AS RowNumber ,DatabaseName ,DatabaseFile_Type ,CAST(1.0 * IO_Read/ (1024 * 1024) AS DECIMAL(12, 2)) AS IO_Read_MB ,CAST(1.0 * IO_Write/ (1024 * 1024) AS DECIMAL(12, 2)) AS IO_Write_MB ,CAST(1. * Total_IO / (1024 * 1024) AS DECIMAL(12, 2)) AS IO_TOTAL_MB ,CAST(IO_STALL / 1000. AS DECIMAL(12, 2)) AS IO_STALL_Seconds ,CAST(100. * IO_STALL / SUM(IO_STALL) OVER() AS DECIMAL(10, 2)) AS IO_STALL_Pct FROM IOFORDATABASE ORDER BY IO_STALL_Seconds DESC
Figure 14-13 shows sample output from this script.
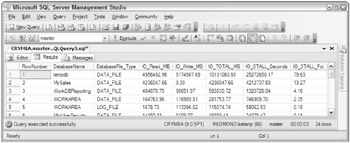
Figure 14-13
Keep in mind that the counters show the value from the time the instance of SQL Server is started, but it gives you a good idea of which database is getting hammered. In this example, you can see that tempdb is being hit hard, but that is not your primary application database, so look at the following row and you'll see that the MySales database is next. It's likely that queries against the MySales database are causing the heavy tempdb usage. This query will give you a good starting point to further investigate the process level (stored procedures, ad-hoc T-SQL statements, etc.) for the database in question.
Next we will look at how to gather the query plan and analyze it. We will also look at the different tools you would need in this process.
Working with the Query Plan
Looking at the query plan is the first step you would take in the process of query tuning. The SQL Server query plan comes in different flavors: textual, graphical, and, with SQL Server 2005, XML format. Showplan is the term used to describe any of these query plan flavors. Different types of Showplans have different information. SQL Server can produce a plan with operators only, with cost information, and with XML format some additional runtime details. The following table summarizes the various Showplan formats.
| Plan Contents | Text Format | Graphical Format | XML Format |
|---|---|---|---|
| Operators | SET SHOWPLAN_TEXT ON | N/A | N/A |
| Operators and estimated costs | SET SHOWPLAN_ALL ON | Displays the estimated execution plan in SQL Server Management Studio | SET SHOWPLAN_XML ON |
| Operators + estimated cardinalities and costs + runtime information | SET STATISTICS PROFILE ON | Displays actual execution plan in SQL Server Management Studio | SET STATISTICS XML ON |
Estimated Execution Plan
This section describes how to get the estimated execution plan. In the next section you will learn how to get the actual execution plan. There are five ways you can get the estimated execution plan: SET SHOWPLAN_TEXT, SET SHOWPLAN_ALL, SET SHOWPLAN_XML, a graphical estimated execution plan using SQL Server Management Studio (now on SSMS), and SQL Trace. The SQL Trace option is covered in a separate section; the other options are described here.
SET SHOWPLAN_TEXT and SET SHOWPLAN_ALL
We start with a simple query to demonstrate how to read the query plan. Open the script SimpleQuery Plan.sql from the Queryplans solution in the sample folder for this chapter. The code for the query is shown here:
USE AdventureWorks GO SET SHOWPLAN_TEXT ON GO SELECT sh.CustomerID, st.Name, SUM(sh.SubTotal) AS SubTotal FROM Sales.SalesOrderHeader sh JOIN Sales.Customer c ON c.CustomerID = sh.CustomerID JOIN Sales.SalesTerritory st ON st.TerritoryID = c.TerritoryID GROUP BY sh.CustomerID, st.Name HAVING SUM(sh.SubTotal) > 2000.00 GO SET SHOWPLAN_TEXT OFF GO
When you SET the SHOWPLAN_TEXT ON, the query will not be executed; it will just produce the estimated plan. The textual plan is shown here:
StmtText ----------------------------------------------------------------------------------- ------ |--Filter(WHERE:([Expr1006]>(2000.00))) |--Hash Match(Inner Join, HASH:([sh].[CustomerID])=([c].[CustomerID])) |--Hash Match(Aggregate, HASH:([sh].[CustomerID]) DEFINE:([Expr1006]=SUM( [AdventureWorks].[Sales].[SalesOrderHeader].[SubTotal] as [sh].[SubTotal]))) | |--Clustered Index Scan(OBJECT:( [AdventureWorks].[Sales].[SalesOrderHeader]. [PK_SalesOrderHeader_SalesOrderID] AS [sh])) |--Merge Join(Inner Join, MERGE:([st].[TerritoryID])=([c].[TerritoryID]), RESIDUAL:([AdventureWorks].[Sales].[SalesTerritory].[TerritoryID] as [st].[TerritoryID]=[AdventureWorks].[Sales].[Customer].[TerritoryID] as [c].[TerritoryID])) |--Clustered Index Scan(OBJECT:( [AdventureWorks].[Sales].[SalesTerritory]. [PK_SalesTerritory_TerritoryID] AS [st]), ORDERED FORWARD) |--Index Scan(OBJECT:( [AdventureWorks].[Sales].[Customer]. [IX_Customer_TerritoryID] AS [c]), ORDERED FORWARD)
I would suggest that you use SSMS to view the plan output because the formatting here doesn't look that good. You can run this query in the AdventureWorks database. Note that in this plan all you have is operators' names and their basic arguments. For more details on the query plan, other options are available. We will explore them soon.
The output tells you that there are seven operators: Filter, Hash Match (Inner Join), Hash Match (Aggregate), Clustered Index Scan, Merge Join, Clustered Index Scan, and Index Scan. They are shown in bold in the query plan.
To analyze the plan you read branches in inner levels before outer ones (bottom to top), and branches that appear in the same level from top to bottom. You can see which branches are inner and which are outer branch based on the position of the pipe (|) character. When the plan is executed, the general flow of the rows is from the top down and from right to left. An operator with more indentation produces rows consumed by an operator with less indentation, and it produces rows for the next operator above, and so forth. For the JOIN operators, there are two input operators at the same level to the right of the JOIN operator denoting the two row sets. The higher of the two (in this case, clustered index scan on the object Sales.SalesTerritory) is referred as the outer table (so Sales.SalesTerritory is the outer table) and the lower (Index Scan on the object Sales.Customer) is the inner table. The operation on the outer table is initiated first, and the one on the inner table is repeatedly executed for each row of the outer table that arrives to the join operator. Please note that the join algorithms are explained in detail later.
Now you can analyze the plan for the query. As you can see in the plan, the hash match (inner join) operation has two levels: hash match (aggregate) and merge join. Now look at the merge join. The merge join has two levels: The first is the clustered index scan on Sales.Territory, and the index scanned on this object is PK_SalesTerritory_TerritoryID. We will talk more about index access methods a little later in the chapter. That is the outer table for the merge join. The inner table Sales.Customer is scanned only once because of the merge join, and that physical operation is done using index scan on index IX_Customer_TerritoryID on the sales.Customer table. The merge join is on the TerritoryID, as per the plan Merge Join(Inner Join, MERGE:([st].[TerritoryID])=([c].[TerritoryID]). Because the RESIDUAL predicate is present in the merge join, all rows that satisfy the merge predicate evaluate the residual predicate, and only those rows that satisfy it are returned.
Now the result of this merge join becomes the inner table for hash match (inner join): Hash Match (Inner Join, HASH:([sh].[CustomerID])=([c].[CustomerID])). The outer table is the result of Hash Match (Aggregate). You can see that the CustomerID is the hash key (HASH:([sh].[CustomerID]) in the hash aggregate operation. Therefore, the aggregation is performed and as per the query, the SUM operation is done on the column SubTotal from the Sales.SalesOrderHeader table (defined by the DEFINE:([Expr1006]). Now the Hash Match (Inner join) operation is performed on CustomerID (the result of the merge join) repeatedly for each row from the outer table (the result of hash match [aggregate]). Finally, the filter is done for SubTotal > 2000.00 with the filter physical operator with the predicate (WHERE:([Expr1006]>(2000.00))).
| Note | The merge join itself is very fast, but it can be an expensive choice if sort operations are required. However, if the data volume is large and the desired data can be obtained presorted from existing B-tree indexes, merge join is often the fastest available join algorithm. In addition, merge join performance can vary a lot based on one-to-many or many-to-many joins. |
In the query file, we have set the SET SHOWPLAN_TEXT OFF following the query. This is because SET SHOWPLAN_TEXT ON is not only causing the query plan to show up, it is also turning off the query execution for the connection. The query execution will be turned off for this connection until you execute SET SHOWPLAN_TEXT OFF on the same connection. The SET SHOWPLAN_ALL command is similar to SET SHOWPLAN_TEXT. The only difference is the additional information about the query plan produced by SET SHOWPLAN_ALL. It adds the estimated number of rows produced by each operator in the query plan, the estimated CPU time, the estimated I/O time, and the total cost estimate that was used internally when comparing this plan to other possible plans.
SET SHOWPLAN_XML
This is a new feature in SQL Server 2005 to retrieve the Showplan in XML form. The output of the SHOWPLAN_XML is generated by a compilation of a batch, so it will produce a single XML document for the whole batch. You can open the ShowPlan_XML.sql from the solution QueryPlans to see how you can get the estimated plan in XML. The query is shown here:
USE AdventureWorks GO SET SHOWPLAN_XML ON GO SELECT sh.CustomerID, st.Name, SUM(sh.SubTotal) AS SubTotal FROM Sales.SalesOrderHeader sh JOIN Sales.Customer c ON c.CustomerID = sh.CustomerID JOIN Sales.SalesTerritory st ON st.TerritoryID = c.TerritoryID GROUP BY sh.CustomerID, st.Name HAVING SUM(sh.SubTotal) > 2000.00 GO SET SHOWPLAN_XML OFF GO
When you run this query in Management Studio, you will see a link in the result tab. Clicking the link opens the XML document inside Management Studio. You can also save that document with the extension .sqlplan. When you open that file using Management Studio, you will get a graphical query plan. The graphical plan from the XML document generated by this query is shown in Figure 14-14.
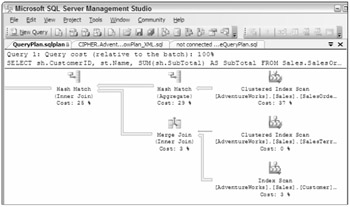
Figure 14-14
XML is the richest format of the Showplan. It contains some unique information not available in other Showplan formats. The XML Showplan contains the size of the plan in cache (the CachedPlanSize attributes) and parameter values for which the plan has been optimized (the Parameter sniffing element). When a stored procedure is compiled for the first time, the values of the parameters supplied with the execution call are used to optimize the statements within that stored procedure. This process is known as parameter sniffing. Also available is some runtime information, which is unique to the XML plan and is described further in the section "Actual Execution Plan."
You can write code to parse and analyze the XML Showplan. This is probably the greatest advantage it offers, as this task is very hard to achieve with other forms of the Showplan.
Refer to the whitepaper at http://msdn.microsoft.com/sql/learning/prog/xml/default.aspx?pull=/library/en-us/dnsql90/html/xmlshowplans.asp. This paper describes how you can extract the estimated execution cost of a query from its XML Showplan using CLR functions. You can use this technique to ensure that users can submit only those queries costing less than a predetermined threshold to a server running SQL Server 2005, thereby ensuring it is not overloaded with costly, long-running queries.
Graphical Estimated Showplan
You can view a graphical estimated plan in Management Studio. To access the plan, either use the short-cut key Ctrl+L or select QueryDisplay Estimated Execution plan. You can also select the button shown in Figure 14-15.
![]()
Figure 14-15
If you use any of these options to display the graphical estimated query plan, it will display the plan as soon as compilation is completed, because compilation complexity can vary according to the number and size of the tables. Right-clicking the graphical plan area in the Execution Plan tab reveals different zoom options and properties for the graphical plan.
Actual Execution Plan
This section describes the four options you can use to get the actual execution plan: SET STATISTICS XML ON|OFF, SET STATISTICS PROFILE ON|OFF, using the graphical actual execution plan option in Management Studio, and using SQL Trace.
SET STATISTICS XML ON|OFF
There are two kinds of runtime information in the XML Showplan: per SQL statement and per thread. If a statement has a parameter, the plan contains the parameterRuntimeValue attribute, which shows the value of each parameter when the statement was executed. The degreeOfParallelism attribute shows the actual degree of parallelism. The degree of parallelism shows the number of concurrent threads working on the single query. The compile time value for degree of parallelism is always half the number of CPUs available to SQL Server unless there are two CPUs in the system. In that case, the value will be 2 as well. The XML plan may also contain warnings. These are events generated during compilation or execution time. For example, missing statistics are a compiler-generated event. One important new feature in SQL Server 2005 is the USE PLAN hint. This feature requires the plan hint in XML format so you can use the XML Showplan. Using the USE PLAN hint, you can force the query to be executed using a certain plan. For example, suppose you found out that a query was running slowly in the production environment, but the same query runs faster in the pre-production environment. You also found out that the plan generated in the production environment is not optimal for some reason. In that case, you can use the better plan generated in the pre-production environment and force that plan in the production environment using the USE PLAN hint. For more details on how to implement it, please refer to the BOL topic "Using the USE PLAN Query Hint."
SET STATISTICS PROFILE ON|OFF
We like this option better, and we always use it for query analysis and tuning. Run the query from earlier as follows. Use the script Statistics_Profile.sql in the QueryPlans solution. The code is shown here. If you don't want to mess with your AdventureWorks database, you can back up and restore the AdventureWorks database with a different name. If you do that, be sure to change the USE <DatabaseName> line in the script. Here is the code:
USE AdventureWorks GO SET STATISTICS PROFILE ON GO SELECT p.name AS ProdName, c.TerritoryID, SUM(od.OrderQty) FROM Sales.SalesOrderDetail od JOIN Production.Product p ON p.ProductID = od.ProductID JOIN Sales.SalesOrderHeader oh ON oh.SalesOrderID = od.SalesOrderID JOIN Sales.Customer c ON c.CustomerID = oh.CustomerID WHERE OrderDate >= '2004-06-09' AND OrderDate <= '2004-06-11' GROUP BY p.name, c.TerritoryID GO SET STATISTICS PROFILE OFF
After you run the query you will get output similar to what is shown in Figure 14-16.

Figure 14-16
The four most important columns in the output of SET STATISTICS PROFILE are Rows, EstimateRows, Executes and of course the StmtText. The Rows column contains the number of rows actually returned by each operator. Now read the plan. We can't fit the whole plan on the page, so run this query on your test machine and look at the output on your screen as you follow along. Start from the inner level, bottom to top. Look at line (or row number) #8 and #9. They are at the same level as the hash match (line #7), so line #8 is the clustered index scan on index PK_SalesOrderHeader_SalesOrderID on the table SalesOrderHeader. This is outer table for the hash match. It scans the clustered index in range, as shown here, although you can't see the entire example in Figure 14-16:
WHERE:([AdventureWorks].[Sales].[SalesOrderHeader].[OrderDate] as [oh].[OrderDate]>='2004-06-09 00:00:00.000' AND [AdventureWorks].[Sales].[SalesOrderHeader].[OrderDate] as [oh].[OrderDate]<='2004- 06-11 00:00:00.000'))
The entire table is scanned for the WHERE clause on the OrderDate column. The estimated rows from this operator are 213, which shows in the EstimatedRows column. The output of this operator is the SalesOrderID and CustomerID columns (not shown in Figure 14-16). Notice that the smaller table (SalesOrderHeader - the table itself is not smaller, but because we have criteria on the OrderDate the result set is smaller) is on the outer side of the hash match because the hash key, CustomerID in this case, is stored in memory after that hash and fewer hashes is better because it requires less memory. Therefore, if you see a hash join in your query and you notice that the outer side table's result set is bigger than the inside table, there may be some plan issue, the supporting indexes don't exist, or the statistics are outdated on these tables, which led the optimizer to estimate an incorrect number of rows. We will look at different index access methods and join algorithms a little later in the chapter.
Now the Sales.Customer table is scanned on the nonclustered index IX_Customer_TerritoryID for CustomerID (see line #9) for the hash match. Why does optimizer choose the nonclustered index IX_Customer_TerritoryID on the Sales.Customer table for scanning CustomerID when it has a clustered index on CustomerID? Look at the query for this example. You have selected the TerritoryID column from the Customer table, and because the leaf level in the nonclustered index also has a clustering key (CustomerID) in this case, the nonclustered index IX_Customer_TerritoryID has necessary information (TerritoryID and CustomerID) at its leaf level for this query. Remember that the leaf level of a nonclustered index has fewer pages than a clustered index of leaf pages (because leaf pages of a clustered index hold the actual data row) so traversing the nonclustered index in this case would cause less I/O (because it needs to access fewer pages). As you can see, the hash match operation has produced 213 rows (see the Rows column for the actual rows produced).
Now let's move up. The hash match (line #7) and clustered index seek (line #10) are at the same level as the nested loop inner join (line #6). The result of the hash match physical operation was 213 rows and the output columns were SalesOrderID and TerritoryID (line #7). You have a join on the Sales.Sales OrderDetail table on the SalesOrderID column, so the SalesOrderID from the hash match operation is now the outer side of the nested loop join; and the clustered index seek on PK_SalesOrderDetail_SalesOrderID_SalesOrderDetailID in the Sales.SalesOrderDetail table is the inner side of the nested loop. The nested loop will look into the inner table for each row from the outer table. Therefore, for 213 SalesOrderIDs (the output of the hash match in line # 7), there will be 213 clustered index seeks performed on the index PK_SalesOrderDetail_SalesOrderID_SalesOrderDetailID. You can see that line #10 indicates 213 in the Executes column, which means that the clustered index on the Sales.SalesOrderDetail table was sought for 213 times, and 580 rows were qualified because of this operation (see the Rows column in line #10). As a result, the nested loop physical operation has produced 580 rows (see line # 6).
Moving up again, the hash match operation (line #4) has two levels: the Index scan on the Product table (line #5) and a nested loop (line #6). The unordered nonclustered index scan on the index AK_Product_Name on the Product table is performed and a hash key is created on the ProductID. Because the Product table has 504 rows, this operation produces 504 rows (see the Rows column in line #5). The inner table (the result of the nested loop join) is probed on the ProductID (remember that the OutputList of the nested loop operation produces columns [od].[OrderQty], [od].[ProductID], and [c].[TerritoryID]). Therefore, the result of the hash match operation is 580 rows (line #4).
Let's move up. Note the Sort operation in line #3. Why is sorting required when you have not asked for it? Because you asked for GROUP BY (a logical operation), and if the optimizer chooses the Stream Aggregate physical operation, then it requires the input to be sorted, which is why you are seeing the Sort operation. The sort is done on TerritoryID and Name in ASC order.
| Note | Sort is a STOP and GO operator. Nothing will come out (to left side of operator) of the Sort operator until all the input rows are processed, so Sort is usually slow. If you don't need sorted data, never add the ORDER BY clause. In this case, because we asked for GROUP BY, we will get ORDER BY for free because of the stream aggregate, so the data already comes sorted. |
Let's move up once again. In line #2, the stream aggregate operation is a result of GROUP BY. This operator will remove the duplicate rows. The number of rows produced by this operator is 273 (the Rows column in line #2). In other words, 307 duplicate rows (580-273) were removed by this operation. In this stream aggregation, the physical operation is chosen by the optimizer. If the optimizer had chosen the hash aggregate option, the Sort operation would have been omitted because hash aggregation doesn't required sorted input. That's it, the result is returned.
Graphical Actual Execution Plan
You can use Management Studio to view the graphical actual execution plan. Again, either use the shortcut key Ctrl+M, select QueryInclude Actual Execution plan, or select the button shown in Figure 14-17.
![]()
Figure 14-17
If you use any of these options to display the graphical actual query plan, nothing will happen. After query execution, the actual plan is displayed in a separate tab.
Join Algorithms
You saw earlier the different type of joins in the query plans. Here we will discuss the physical strategies SQL Server can use to process joins. Before SQL Server 7.0, there was only one join algorithm, called nested loops. Since version 7.0, SQL Server supports hash and merge join algorithms. This section describes each of them here and where and when they provide better performance.
Nested Loop or Loop Join
The nested loop join, also called nested iteration, uses one join input as the outer input table (shown as the top input in the graphical execution plan; see Figure 14-18) and the other input as the inner (bottom) input table. The outer loop consumes the outer input table row by row. The inner loop, executed for each outer row, searches for matching rows in the inner input table. You can use the Join.sql script from the QueryPlans solution for the following exercises. The following query is an example that produces a nested loop join:
--Nested Loop Join SELECT C.CustomerID, c.TerritoryID FROM Sales.SalesOrderHeader oh JOIN Sales.Customer c ON c.CustomerID = oh.CustomerID WHERE c.CustomerID IN (10,12) GROUP BY C.CustomerID, c.TerritoryID

Figure 14-18
A nested loop join is particularly effective if the outer input is small and the inner input is preindexed and large. In many small transactions, such as those affecting only a small set of rows, index nested loop joins are superior to both merge joins and hash joins. In large queries, however, nested loop joins are often not the optimal choice. Of course, the presence of a nested loop join operator in the execution plan doesn't indicate whether it's an efficient plan or not. A nested loop join is the default algorithm, so it can always be applied if another algorithm does match the specific criteria. For example, the "requires join" algorithm must be equijoin (the join condition is based on the equality operator).
In the example query, a clustered index seek is performed on the outer table Customer for CustomerID 10 and 12, and for each CustomerID, an index seek is performed on the inner table SalesOrderHeader. Therefore, Index IX_SalesOrderHeader_CustomerID is sought two times (one time for CustomerID 10 and one time for CustomerID 12) on the SalesOrderHeader table.
Hash Join
The hash join has two inputs like every other join: the build input (outer table) and the probe input (inner table). The query optimizer assigns these roles so that the smaller of the two inputs is the build input. A variant of the hash join (Hash Aggregate physical operator) can do duplicate removal and grouping, such as SUM (OrderQty) GROUP BY TerritoryID. These modifications use only one input for both the build and probe roles.
The following query is an example of a hash join, and is shown in Figure 14-19:
--Hash Match SELECT p.Name As ProductName, ps.Name As ProductSubcategoryName FROM Production.Product p JOIN Production.ProductSubcategory ps ON p.ProductSubcategoryID = ps.ProductSubcategoryID ORDER BY p.Name, ps.Name

Figure 14-19
As discussed earlier, the hash join first scans or computes the entire build input and then builds a hash table in memory if it fits the memory grant (in Figure 14-19, it is the Production.ProductSubCategory table). Each row is inserted into a hash bucket depending on the hash value computed for the hash key, so building the hash table needs memory. If the entire build input is smaller than the available memory, all rows can be inserted into the hash table (you will see what happens if there is not enough memory shortly). This build phase is followed by the probe phase. The entire probe input (in Figure 14-19, it is the Production.Product table) is scanned or computed one row at a time, and for each probe row (from the Production.Product table), the hash key's value is computed, the corresponding hash bucket (the one created from the Production.ProductSubCategory table) is scanned, and the matches are produced. This strategy is called an in-memory hash join.
If you're talking about the AdventureWorks database running on your laptop with 1GB RAM, you won't have the problem of not fitting the hash table in memory. In the real world, however, with millions of rows in a table, it's possible there won't be enough memory to fit the hash table. If the build input does not fit in memory, a hash join proceeds in several steps. This is known as a grace hash join. In this hash join strategy, each step has a build phase and a probe phase. Initially, the entire build and probe inputs are consumed and partitioned (using a hash function on the hash keys) into multiple files. Using the hash function on the hash keys guarantees that any two joining records must be in the same pair of files. Therefore, the task of joining two large inputs has been reduced to multiple, but smaller, instances of the same tasks. The hash join is then applied to each pair of partitioned files. If the input is so large that the preceding steps need to be performed many times, multiple partitioning steps and multiple partitioning levels are required. This hash strategy is called a recursive hash join.
| Note | SQL Server always starts with an in-memory hash join and changes to other strategies if necessary. |
Recursive hash joins or hash bailouts cause reduced performance in your server. If you see many Hash Warning events in a trace (the Hash Warning event is under the Errors and Warnings event class), update statistics on the columns that are being joined. You should capture this event if you see that you have many hash joins in your query. This will ensure that hash bailouts are not causing performance problems on your server. When good indexes on join columns are missing, the optimizer normally chooses the hash join.
Merge Join
The merge join relies on sorted input and is a very efficient algorithm if both inputs are available sorted (see Figure 14-20):
SELECT oh.SalesOrderID, oh.OrderDate,od.ProductID FROM Sales.SalesOrderDetail od JOIN Sales.SalesOrderHeader oh ON oh.SalesOrderID = od.SalesOrderID

Figure 14-20
With a one-to-many join, a merge join operator scans each input only once, which is why it is superior to other operators if the predicate is not very selective. For sorted input, the optimizer can use a clustered index. If there is a nonclustered index covering the join and select columns, the optimizer would probably choose that option because it will have to fetch fewer pages. A many-to-many merge join is little more complicated. A many-to-many merge join uses a temporary table to store rows. If there are duplicate values from each input, one of the inputs will have to rewind to the start of the duplicates as each duplicate from the other input is processed.
In this query, both tables have a clustered index on the SalesOrderID column, so the optimizer chooses a merge join. Sometimes the optimizer chooses the merge join, even if one of the inputs is not presorted by an index, by adding a sort to the plan. The optimizer would do that if the input were small. If the optimizer chooses to sort before the merge, check whether the input has many rows and is not presorted by an index. To prevent the sort, you will have to add the required indexes to avoid a costly operation.
Index Access Methods
This section describes different index access methods. You can use this knowledge when you tune the query and decide whether a query is using the correct index access method or not and take the appropriate action.
In addition, you should make a copy of the AdventureWorks database on your machine so that if you drop or create indexes on it, the original AdventureWorks database stays intact. The copy database is AdWork in these examples.
Table Scan
A table scan involves a sequential scan of all data pages belonging to the table. Run the following script in the AdWork database:
SELECT * INTO dbo.New_SalesOrderHeader FROM Sales.SalesOrderHeader
Once you run this script to make a copy of the SalesOrderHeader table, run the following script:.
SELECT SalesOrderID, OrderDate, CustomerID FROM dbo.New_SalesOrderHeader
Because this is a heap, this statement will cause a table scan. If you want you can always get the actual textual plan using SET STATISTICS PROFILE ON. Figure 14-21 displays the graphical plan.
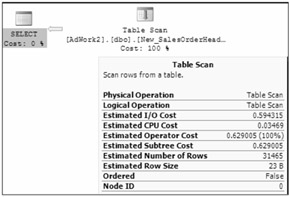
Figure 14-21
In a table scan, SQL Server uses Index Allocation Map (IAM) pages to direct the disk arm to scan the extants belonging to the table by their physical order on disk. As you might guess, the number of logical reads would be the same as the number of pages for this table.
SET STATISTICS IO ON|OFF
Let's look at the STATISTICS IO output for the example query. This is a session-level setting. STATISTICS IO provides you with I/O-related information for the statement you run.
| Note | SET STATISTICS IO is set at runtime and not at parse time. This is an important tool in your query-tuning arsenal, as disk I/Os are normally a bottleneck on your system, so it is very important to identify how many I/Os your query generates and whether they are necessary or not. |
DBCC DROPCLEANBUFFERS GO SET STATISTICS IO ON GO SELECT SalesOrderID, OrderDate, CustomerID FROM dbo.New_SalesOrderHeader GO SET STATISTICS IO OFF Table 'New_SalesOrderHeader'. Scan count 1, logical reads 799, physical reads 0, read-ahead reads 798, lob logical reads 0, lob physical reads 0, lob read-ahead reads 0.
The scan count tells you how many times the table was accesses for this query. If you have multiple tables in your query, you will see statistics showing I/O information for each table. In this case, the New_SalesOrderHeader table was accessed once.
The logical reads counter indicates how many pages were read from the data cache. In this case, 799 reads were done from cache. As mentioned earlier, because of the whole table scan, the number of logical reads equals the number of pages allocated to this table. You can also run the following query to verify the number of pages allocated to the table. Note the resulting number in the dpages column.
SELECT dpages, * FROM sys.sysindexes WHERE ID = OBJECT_ID('New_SalesOrderHeader')
The physical reads counter indicates the number of pages read from the disk. It shows 0 in the preceding code. Does that mean that there were no physical reads from disk? No; keep reading.
The read-ahead reads counter indicates the number of pages from the physical disk that were placed into the internal data cache when SQL Server guesses that you will need them later in the query. In this case, this counter shows 798, which means that many physical reads. Both the physical reads and read-ahead reads counters indicate the amount of physical disk activity.
The lob logical reads, lob physical reads, and lob read-ahead reads are the same as the other reads, but these counters indicate reads for the large objects - for example, if you read a column with the data type varchar(max), nvarchar(max), xml, or varbinary(max). Note that when T-SQL statements retrieve LOB columns, some LOB retrieval operations might require traversing the LOB tree multiple times. This may cause SET STATISTICS IO to report higher than expected logical reads.
Clearing Caches
The first statement in the example query is DBCC DROPCLEANBUFFERS. In a query-tuning exercise, this command is very handy to clear the data cache globally. If you run the query a second time but comment out the DBCC DROPCLEANBUFFERS statement first, the read-ahead reads counter will be 0, which means that the data pages you have asked for are already in the data cache (buffer pool). In your query-tuning exercises, make sure that when you run your query a second time after making some changes, you clear the data cache so that you get the correct I/O information and so does the query runtime.
The other important command to clear the plan cache (not data cache) is DBCC FREEPROCCACHE. It will clear the execution plan from cache globally.
If you want to clear the execution plans for a particular database, you can run the following undocumented command:
DBCC FLUSHPROCINDB(<db_id>) | Note | Please do not run these commands in your production system because clearing the cache will obviously have a performance impact. When you do query tuning in your development/test environment, be aware of this effect. |
Clustered Index Scan (Unordered)
Try creating a clustered index on the New_SalesOrderHeader table. A clustered index is structured as a balanced tree (all indexes in SQL Server are structured as balanced trees). A balanced tree is one in which "no leaf is much farther away from the root than any other leaf" (adopted from www.nist.gov). Different balancing schemes allow different definitions of "much farther" and different amounts of work to keep them balanced. A clustered index maintains the entire table's data in its leaf level (a clustered index is not a copy of the table's data; it is the data).
Let's run a query to see the effect of adding a clustered index. Run the following script, which is available in the QueryPlans solution as IndexAccess.sql:
CREATE CLUSTERED INDEX IXCU_SalesOrderID ON New_SalesOrderHeader(SalesOrderID) Now run this script:
DBCC DROPCLEANBUFFERS GO SET STATISTICS IO ON GO SELECT SalesOrderID, RevisionNumber, OrderDate, DueDate FROM New_SalesOrderHeader GO SET STATISTICS IO OFF
The results of Statistics IO is shown here, and the query plan is shown in Figure 14-22.
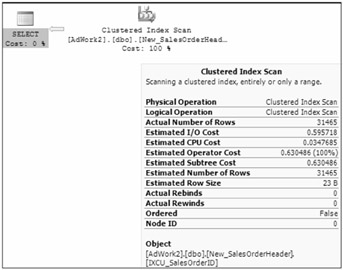
Figure 14-22
Table 'New_SalesOrderHeader'. Scan count 1, logical reads 805, physical reads 1, read-ahead reads 801, lob logical reads 0, lob physical reads 0, lob read-ahead reads 0.
As you can see in the Statistics IO output, the number of pages read was 805 (logical reads), which is the same as the table scan (a little more because the leaf level in a clustered index also contains unique row information, and a link to the previous and next page in a doubly linked list, so more space is required to hold that information). As you can see, even though the execution plan shows a clustered index scan, the activities are the same as the table scan, so unless you have a predicate on a clustered index key, the whole clustered index will be scanned to get the data, which is the same as a table scan. You can also see in Figure 14-22, in the information box of the clustered index scan operators, that the scan was not ordered (Ordered = False), which means that the access method did not rely on the linked list that maintains the logical order of the index. Let's see what happens if we create a covering nonclustered index on the table.
Covering Nonclustered Index Scan (Unordered)
A covering index means that a nonclustered index contains all the columns specified in a query. Let's look at this using the same query used in the previous example:
CREATE NONCLUSTERED INDEX IXNC_SalesOrderID ON New_SalesOrderHeader(OrderDate) INCLUDE(RevisionNumber, DueDate) GO DBCC DROPCLEANBUFFERS GO SET STATISTICS IO ON GO SELECT SalesOrderID,RevisionNumber, OrderDate, DueDate FROM New_SalesOrderHeader GO SET STATISTICS IO OFF
This script creates a nonclustered index on the OrderDate column. Notice the INCLUDE clause with the column names RevisionName and DueDate. INCLUDE is a new feature in SQL Server 2005 whereby you can specify the non-key columns to be added to the leaf level of the nonclustered index. The RevisionName and DueDate columns are included because your query needs these columns. The nonclustered index is chosen for this operation so that the data can be served directly from the leaf level of the nonclustered index (because the non-clustered index has the data for these included columns). See the CREATE INDEX topic in BOL for details on the INCLUDE clause. The statistics I/O information for the query is shown here:
Table 'New_SalesOrderHeader'. Scan count 1, logical reads 96, physical reads 1, read-ahead reads 94, lob logical reads 0, lob physical reads 0, lob read-ahead reads 0.
The query plan is shown in Figure 14-23.
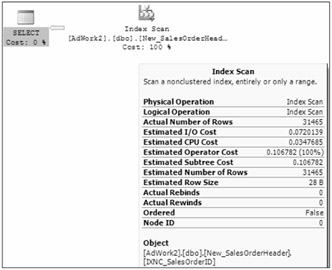
Figure 14-23
As you can see from the statistics I/O result, only 96 logical reads were done to fulfill this query. Notice that the results returned by the clustered index query in and by the covering nonclustered index query are identical (in the number of columns and number of rows), but there were 805 logical reads in the clustered index and only 96 logical reads in the nonclustered scan, because the nonclustered index has covered the query and served the data from its leaf level.
The clustered index leaf level contains the full data rows (all columns), whereas the nonclustered index has only one key column and two included columns. That means the row size is smaller for a nonclustered index, and the smaller row size can hold more data and requires less I/O.
Clustered Index Scan (Ordered)
An ordered clustered index scan is also a full scan of the clustered index, but the data is returned in order by the clustering key. This time, you'll run the same query as before, but ordered by the SalesOrderID column:
DBCC DROPCLEANBUFFERS GO SET STATISTICS IO ON GO SELECT SalesOrderID,RevisionNumber, OrderDate, DueDate FROM New_SalesOrderHeader ORDER BY SalesOrderID GO SET STATISTICS IO OFF
The statistics IO information is as follows:
Table 'New_SalesOrderHeader'. Scan count 1, logical reads 805, physical reads 1, read-ahead reads 808, lob logical reads 0, lob physical reads 0, lob read-ahead reads 0.
The query plan is shown in Figure 14-24.
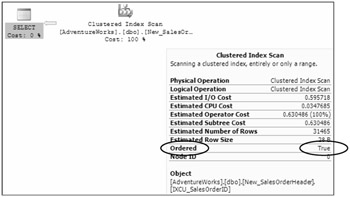
Figure 14-24
As you can see, the query plan is the same as the one in Figure 14-22, but here we have Ordered = True, as highlighted in Figure 14-24. The statistics IO information is also the same as the unordered clustered index scan. Note that unlike the unordered clustered index scan, the performance of the ordered clustered index scan depends on the fragmentation level of the index. Fragmentation is out-of-order pages, which means that although Page 1 appears logically after Page 2 according to the linked list, physically Page 2 comes before Page 1. The percentage of fragmentation is greater if more pages in the leaf level of the index are out of order with respect to the total number of pages. Note that moving the disk arm sequentially is always faster than random arm movement, so if the fragmentation is higher than for ordered data, there will be more random arm movement, resulting in slower performance.
| Note | If you do not need the data sorted, then do not include the ORDER BY clause. |
Also note that even though you have a covering nonclustered index, the optimizer did not choose it this time (as in Figure 14-23) because you asked that the data be sorted on the SalesOrderID column (which is obviously not sorted on the leaf level of the nonclustered index).
Covering Nonclustered Index Scan (Ordered)
If you run the previous query with OrderDate in the ORDER BY clause, the optimizer would choose the covering nonclustered index. The query plan would be exactly same as shown in Figure 14-23, except that you would see Ordered = True in the information box. The statistics IO information will also be the same as for the non-ordered covering nonclustered index scan. Of course, an ordered index scan is not only used when you explicitly request the data sorted; the optimizer can also choose to sort the data if the plan uses an operator that can benefit from sorted data.
Nonclustered Index Seek with Ordered Partial Scan and Lookups
To demonstrate this access method, you first have to drop the clustered index on the New_SalesOrder Header table. Now run the following script:
DROP INDEX New_SalesOrderHeader.IXCU_SalesOrderID GO DBCC DROPCLEANBUFFERS GO SET STATISTICS IO ON GO SELECT SalesOrderID,RevisionNumber, OrderDate, DueDate FROM New_SalesOrderHeader WHERE OrderDate BETWEEN '2001-10-08 00:00:00.000' AND '2001-10-10 00:00:00.000' GO SET STATISTICS IO OFF
The statistics IO looks like this:
(25 row(s) affected) Table 'New_SalesOrderHeader'. Scan count 1, logical reads 27, physical reads 3, read-ahead reads 0, lob logical reads 0, lob physical reads 0, lob read-ahead reads 0.
The query execution plan is shown in Figure 14-25.
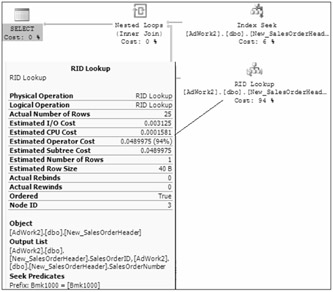
Figure 14-25
Remember that you don't have a clustered index on this table. This is called a heap. In the query, you have requested the SalesOrderID, RevisionNumber, OrderDate, DueDate, and SalesOrderNumber columns, and added a predicate on the OrderDate column. Because of the predicate on the key column in the IXNC_SalesOrderID index, the optimizer will choose this index and look for all the rows that have the OrderDate specified in the WHERE clause. This index also has all the columns at its leaf level except for SalesOrderID. To find the SalesOrderID column value, SQL Server performs RID lookups of the corresponding data row for each key. As each key is found, SQL Server can apply the lookup. In addition, because this is a heap table, each lookup translates to a single page read. Because there are 25 rows qualified by the WHERE clause, there will be 25 reads for data row lookup. If you look at the statistics IO information, there are 27 logical reads, which means that out of those 27 logical reads, 25 are the result of the RID lookup. You can probably guess that most of the cost in this query is in the RID lookup, which is also evident in the query plan, where you can see that the cost of the RID lookup operation is 94%. Lookups are always random I/Os (as opposed to sequential), which are more costly. When seeking many times, however, SQL Server often sorts to make I/Os more sequential.
This query plan was an RID lookup on a heap. Create your clustered index and run the same query again:
CREATE CLUSTERED INDEX IXCU_SalesOrderID ON New_SalesOrderHeader(SalesOrderID) GO DBCC DROPCLEANBUFFERS GO SET STATISTICS IO ON GO SELECT SalesOrderID,RevisionNumber, OrderDate, DueDate, SalesOrderNumber FROM New_SalesOrderHeader WHERE OrderDate BETWEEN '2001-10-08 00:00:00.000' AND '2001-10-10 00:00:00.000' GO SET STATISTICS IO OFF
The following code shows the statistics IO output for this query:
(25 row(s) affected) Table 'New_SalesOrderHeader'. Scan count 1, logical reads 77, physical reads 4, read-ahead reads 0, lob logical reads 0, lob physical reads 0, lob read-ahead reads 0.
Figure 14-26 shows the query plan for this query.

Figure 14-26
The query plans in Figure 14-25 and Figure 14-26 are almost identical except that in Figure 14-26 a clustered index is sought for each row found in the outer reference (the nonclustered index). Once again, you can see in Figure 14-26 that the clustered index seek incurs most of the cost (94%) for this query, but take a look at the statistics IO information for the two queries. The logical reads in the clustered index seek query plan are a lot higher than those in the RID lookup plan. Does that mean that a clustered index on the table is not so good? No. This index access method is efficient only when the predicate is highly selective, or a point query. Selectivity is defined as the percentage of the number of rows returned by the query out of the total number of rows in the table. A point query is one that has an equals (=) operator in the predicate. Because the cost of the lookup operation is greater, the optimizer decided to just do the clustered index scan. For example, if you change the WHERE clause in the query to WHERE OrderDate BETWEEN '2001-10-08 00:00:00.000' AND '2001-12-10 00:00:00.000', then the optimizer would just do the clustered index scan to return the result for that query. Remember that the nonleaf levels of the clustered index typically reside in cache because of all the lookup operations going through it, so you shouldn't concern yourself too much about the higher cost of the query in the clustered index seek scenario shown in Figure 14-26.
Clustered Index Seek with Ordered Partial Scan
This is a simple one. The optimizer normally uses this technique for range queries, in which you filter based on the first key column of the clustered index. Run the following query:
DBCC DROPCLEANBUFFERS GO SET STATISTICS IO ON GO SELECT SalesOrderID,RevisionNumber, OrderDate, DueDate, SalesOrderNumber FROM New_SalesOrderHeader WHERE SalesOrderID BETWEEN 43696 AND 45734 GO SET STATISTICS IO OFF
The statistics IO output is as follows:
(2039 row(s) affected) Table 'New_SalesOrderHeader'. Scan count 1, logical reads 56, physical reads 1, read-ahead reads 53, lob logical reads 0, lob physical reads 0, lob read-ahead reads 0.
The query plan is show in Figure 14-27.
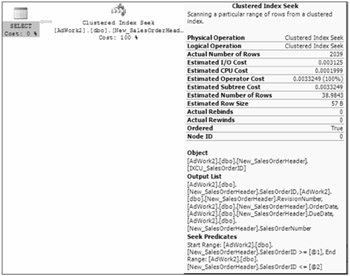
Figure 14-27
This index access method first performs a seek operation on the first key (43696 in this case) and then performs an ordered partial scan at the leaf level, starting from first key in the range and continuing until the last key (45734). Because the leaf level of the clustered index is actually the data rows, no lookup is required in this access method.
Look at Figure 14-28 to understand the I/O cost for this index access method. To read at least a single leaf page, the number of seek operations required is equal to the number of levels in the index.
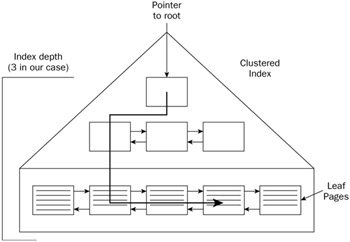
Figure 14-28
How do you find the level in the index? Run the INDEXPROPERTY function with the IndexDepth property:
SELECT INDEXPROPERTY (OBJECT_ID('New_SalesOrderHeader'), 'IXCU_SalesOrderID', 'IndexDepth')
In this case, the index depth is 3, and of course the last level is the leaf level where the data resides. As shown in Figure 14-28, the cost of the seek operation (three random reads in this case, because that is the depth of the index) and the cost of the ordered partial scan within the leaf level to get the data (in this case 53, according to the read-ahead reads) add up to 56 logical reads, as indicated in the statistics IO information. As you can see, an ordered partial scan typically incurs the bulk of the cost of the query because it involves most of the I/O to scan the range (53 in this case). As mentioned earlier, index fragmentation plays an important role in ordered partial scan operations, so when there is high fragmentation in the index, the disk arm needs to move a lot, which results in degraded performance.
Note that this plan is called a trivial plan, which means that there is no better plan than this, and the plan does not depend on the selectivity of the query. As long as you have a predicate on the SalesOrderID columns, no matter how many rows are sought, the plan will always be the same unless you have a better index that the plan chooses in this case. Try adding the following index on this table. Then run the query again and see what happens and why. Notice which index is chosen by the optimizer, and the number of logical reads compared to that in Figure 14-27:
CREATE NONCLUSTERED INDEX IXNC_SalesOrderID_2 ON New_SalesOrderHeader(SalesOrderID, OrderDate) INCLUDE(RevisionNumber, DueDate, SalesOrderNumber)
Now drop the index after you are done with the exercise:
DROP INDEX New_SalesOrderHeader.IXNC_SalesOrderID_2 Note that you cannot keep adding indexes on your table, because maintaining those indexes is not free. Maintaining a balance tree is a costly operation because of the physical data movement involved when you modify data. Proceed cautiously and analyze the cost of adding indexes for data modification operations, especially on an OLTP system.
Fragmentation
This section elaborates on the topic of index fragmentation covered earlier. There are two types of fragmentation: logical scan fragmentation and average page density. Logical scan fragmentation is the percentage of out-of-order pages in the index in regard to their physical order as opposed to their logical order in the linked list. This fragmentation has a substantial impact on ordered scan operations like the one shown in Figure 14-27. This type of fragmentation has no impact on operations that do not rely on an ordered scan, such as seek operations, unordered scans, or lookup operations.
The average page density is the percentage of pages that are full. A low percentage (fewer pages full) has a negative impact on the queries that read the data because these queries end up reading more pages than they could were the pages better populated. The upside of having free space in pages is that insert operations in these pages do not cause page splits, which are very expensive. In short, free space in pages is bad for a data warehouse type of system (more read queries), whereas it is good for an OLTP system that involves many data modification operations.
Rebuilding the indexes and specifying the proper fill factor based on your application will reduce or remove the fragmentation. You can use following DMF to find out both types of fragmentation in your index. For example, to find out the fragmentation for indexes on the New_SalesOrderHeader table, run the following query:
SELECT * FROM sys.dm_db_index_physical_stats (DB_ID(), OBJECT_ID('dbo.New_SalesOrderHeader'), NULL, NULL, NULL)
Look for the avg_fragmentation_in_percent column for logical fragmentation. Ideally, it should be 0, which indicates no logical fragmentation. For average page density, look at the avg_page_space_ used_in_percent column. It shows the average percentage of available data storage space used in all pages.
| Note | DBCC SHOWCONTIG was another way to get this information in SQL Server 2000. DBCC SHOWCONTIG will be deprecated in a future release of SQL Server, so do not use it. |
There is new feature in SQL Server 2005 to build the indexes online. This feature enables you to create, drop, and rebuild the index online. See Chapter 15 for more details. The following is an example of rebuilding the index IXNC_SalesOrderID on the New_SalesOrderHeader table:
ALTER INDEX IXNC_SalesOrderID ON dbo.New_SalesOrderHeader REBUILD WITH (ONLINE = ON)
Statistics
Microsoft SQL Server 2005 collects statistics about individual columns (single-column statistics) or sets of columns (multi-column statistics). Note that a histogram is only collected for the leading column. The query optimizer uses these statistics to estimate the selectivity of expressions, and thus the size of intermediate and final query results. Good statistics enable the optimizer to accurately assess the cost of different query plans, and choose a high-quality plan. All information about a single statistics object is stored in several columns of a single row in the sysindexes table, and in a statistics binary large object (statblob) kept in an internal-only table.
If you see in your execution plan that there is a large difference between the estimated row count and the actual row count, the first thing you should check are the statistics on the join columns and the column in the WHERE clause for that table (be careful with the inner side of loop joins; the row count should match the estimated rows multiplied by the estimated executions). Make sure that the statistics are current. Check the UpdateDate, Rows, and Rows Sampled columns (DBCC SHOW_STATISTICS). It is very important that you keep up-to-date statistics. You can use the following views and command to get the details about statistics.
To see how many statistics exist in your table you can use the sys.stats view. To view which columns are part of the statistics, use the sys.stats_columns view. To view the histogram and density information, you can use DBCC SHOW_STATISTICS. For example, to view the histogram information for the IXNC_SalesOrderID index on the New_SalesOrderHeader table, run the following command:
DBCC SHOW_STATISTICS ('dbo.New_SalesOrderHeader', 'IXNC_SalesOrderID')
Data Modification Query Plan
When you execute data modification plans, the plan has two stages. The first stage is read-only, and determines which rows need to be inserted, updated, or deleted. It generates the data stream to describe the changes. For INSERT statements you will have column values, so the data stream contains the column values. DELETE statements have key column(s), and UPDATE statements have both data streams, the changed columns' values, and the table key. If you have foreign keys, the plan includes doing constraint validation. It also maintains indexes; and if any triggers exist, it fires these triggers as well.
There are two strategies for INSERT, UPDATE, and DELETE statements: per-row and per-index maintenance. Consider the following DELETE query, which has a per-row query plan:
DELETE FROM New_SalesOrderHeader WHERE OrderDate = '2001-07-01 00:00:00.000'
The query plan is shown in Figure 14-29.
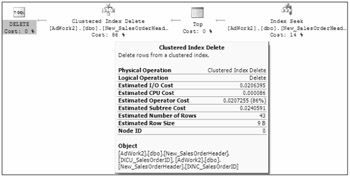
Figure 14-29
With a per-row plan, SQL Server maintains the indexes and the base table together for each row affected by the query. The updates to all nonclustered indexes are performed in conjunction with each row update on the base table. Note that the base table could be a heap or a clustered index. If you look at the Clustered Index Delete information box in Figure 14-29, in the Object information you will notice that both the clustered index and the nonclustered index are listed, which indicates that the indexes are maintained with a per-row operation.
Because of the short code path and update to all indexes and tables together, the per-row update strategy is more efficient in term of CPU cycles.
Now consider another query plan with the following query. The change in this query is to the WHERE clause (changed to <=). We're using the Sales.SalesOrderHeader table to produce the plan for this example:
DELETE FROM Sales.SalesOrderHeader WHERE OrderDate < '2003-07-01 00:00:00.000'
The query plan is shown in Figure 14-30. Note that this figure only shows part of the plan because there are so many indexes on this table in the AdventureWorks database.
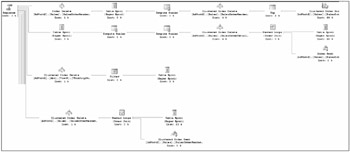
Figure 14-30
This query plan is performing per-index maintenance. The plan first deletes qualifying rows from the clustered index and at the same time builds the temporary spool table containing the clustering key values for the other nonclustered indexes that must be maintained. SQL Server reads the spool data as many times as the number of nonclustered indexes on the table. The sort operator between the index delete operator and the spool operator indicates that SQL Server sorts the data according to the key column of the index it is about to delete so that the index pages can be accessed optimally. The sequence operator enforces the execution order of each branch. SQL Server updates the indexes one after another from the top of the plan to the bottom.
As you can see from the query plan, per-index maintenance is more complicated, but because it maintains individual indexes after sorting the key (Sort operator), it will never visit the same page again, saving in I/O. Therefore, when you are updating many rows, the optimizer usually chooses the per-index plan.
| Note | Your disk configuration is also important in designing write/read-intensive operations. See Chapter 11 for more information. |
Partitioned Table Query Plan
If you have a predicate on the partition key when you query a partition table, make sure that partitioning pruning is on. (For details on partitioned tables, please refer to Chapter 15, "Indexing Your Database.") See the partition table query in Figure 14-31.
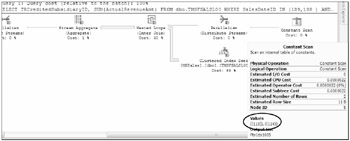
Figure 14-31
In Figure 14-31, notice in the Constant Scan details the Values field at the end of the information box. These values show how many partitions your query will read to look for data you have requested. In this case, it is reading two partitions numbered 113 and 114. If you do not see any values, your query is looking into all the available partitions for the data you have requested. In that case, you want to verify that you have the correct predicate on this query. If the query scans all the partitions, which you may not want, it could generate a lot of I/O and slow your query down.
Gathering Query Plans for Analysis with SQL Trace
Earlier you examined the query plans with different option such as SET STATISTICS PROFILE ON and SET STATISTICS XML ON. This technique does not work when you want to gather the query plans in your production environment. You have to use SQL Trace to get the query plan for analysis. We have provided the trace file you can import into your SQL Trace to gather data for query plan analysis. You can create a server-side trace from this template. See Chapter 13 for details about how to create server-side traces and import the trace data into a database table. We recommend that you create a server-side trace so that you don't miss any events. In addition, import the data into a database table for analysis rather in SQL Profiler because SQL Profiler doesn't have as many options to play with data.
The template for query plan gathering in your environment is in the samples folder for this chapter. The trace template name is QueryPlanAnalysis.tdf. Please make sure that you set filters for your criteria to gather the data, because the file size will grow very quickly. In addition, depending on whether you prefer a textual execution plan or XML, you can check one of the events Showplan Statistics Profile or Showplan XML Statistics Profile.
EAN: 2147483647
Pages: 193