Step 4: What to Do with a Problematic Action
Step 4: What to Do with a Problematic Action
When you find a problematic action, you need to resolve it. It's not always easy to figure out why an action was problematic, however. The causes could be everything and anything, or nothing. The first step in determining a problematic action is to find the factors that influence the action.
Simple Problematic Actions
You can easily solve a simple problematic action because only one fault is evident. Perhaps this single fault is that an inexperienced developer carried out a specific action, resulting in a longer implementation time. The solution to this simple problematic action is to assign the developer to another action that better suits him.
When you apply a solution to a simple problematic action, this particular problematic action does not surface again, at least not in the same way. If a problematic action keeps coming up, then the action is complex, not simple.
Complex Problematic Actions
A complex problematic action is more complicated than a simple one because you have more than one problem to resolve. In addition, it is often difficult to figure out what the exact problems are. One way to figure them out is to trace past projects and set up an experiment to test a hypothesis. In statistics, this process is called robust design . This process is beyond the scope of this book. If you want more information, search for materials on "robust design" and "Taguchi Quality Methods." Here, we will use the matrix approach to decompose the problematic action and design an experiment. The matrix approach is where actions, attributes, and factors are weighed against each other to find out what the cause of the problematic action is.
To figure out the cause of a problematic action, you need to break the project actions down into various factors. In addition, you need to assign to each factor a series of variable values. In the next few sections, we discuss some factors that you can use in your own projects. These factors are just examples. In your situation, you may have more, fewer, or entirely different factors.
Factor: Programming
The programming factor indicates whether or not the code was well written. The programming factor does not include the design of the code, because that is another factor. This factor deals solely with what you intended to accomplish. An indication of a bad programming factor is if it takes longer to debug the implementation than it did to implement it. This book focuses on how to manage this aspect of the software engineering cycle.
Factor: Design
The design factor indicates whether or not the project was well designed. The scope of the design factor includes the design of the UML model, interfaces, and higher-level items. It does not include the documentation but is based on the content of the documentation. This book focuses on the design of the software engineering cycle, too.
Factor: QA
The QA design factor indicates how well the action was tested , if testing was necessary. QA is problematic when the tests were incorrectly set up, when the tests were not correctly started, and when the bugs are not caught and are present when the end- user uses the application.
Factor: Programming Tools
The programming tools factor indicates which programming tools (such as editors, compilers, and build tools) are giving problems. It becomes a problem when the programmer or QA team member achieves poor productivity. The productivity of the tools is a very touchy issue because some people swear they are productive using editors like emacs or vi. This statement may or may not be true since it depends on whether the user is productive and comfortable with the tool. So, the objective is to figure out if the lack of productivity relates to inexperience or if it is not the right tool for the person.
Factor: Hardware Used
The hardware factor is when a person in the team cannot perform his daily work because of hardware problems. Defective or slow hardware can cause hardware problems, but so can configuration issues. Maybe the security of the environment is restricted so much that a developer has to do many tricks to get his work done.
Another cause of a hardware problem is when people use non-mainstream configurations. This type of problem occurred when multi-processor machines first became available for PCs. Windows NT was not optimized for multi-processor machines, so such compu- ters would periodically lock for no apparent reason. Software changes were lost, and productivity slowed to a crawl.
Factor: Communication
One of the most important aspects of the software engineering process is communication. Communication includes documentation, e- mails , and meetings. The documentation of the software project is included in communication because the technique of documentation could cause people to become confused and issue bug reports when in fact the documentation was incorrect.
Factor: Contracts
Contracts are a factor in the action because they are often created by your team and other companies, departments, or teams . The problem with contracts is that they often have absolutely nothing to do with the implementation of the project. The contract is orthogonal to the software, but the contract can dictate conditions that can influence a project for better or worse .
A contract that does not allocate enough time for project completion would be an example of a contract influencing the project for the worse. If you have too little time, all of the actions will be rushed, so the quality of the project will suffer. Another problematic contract might not allocate enough money, which strains the resources.
Constructing a Problematic Matrix
After you have found the factors, you must assign values to them and then generate a problematic matrix. A problematic matrix is a simplification of a robust-design orthogonal matrix. In robust design, you use an orthogonal matrix to generate experiments, whereas you use a problematic matrix to figure out what went wrong and then try some new ideas to fix the problem. When the investigator of the matrix generates a problematic matrix, looking at past projects will help him immensely because he will be able to identify trends and patterns.
For each factor defined, you need to define a set of valid states, such as:
Programming : John, Michael, Lisa, Marie
Tools : editor1, editor2, editor3, editor 4, etc
Communication : Paper communications, Paper and phone communications, Paper, Phone, and e-mail communications
Next, you add these factors and valid states to the problematic matrix, as shown in Table A.1
| Programming | Tools | Communication | Action | Difference |
|---|---|---|---|---|
| John | editor1 | Paper | Implement module 1 | 30 |
| Lisa | editor2 | Paper | Implement module 2 | 25 |
If you analyze this table, you'll see in the Action column that the implementation of module 1 produced a bigger difference than the implementation of module 2 as defined in the Difference column. It seems that the difference in implementation has to do with the tools that John and Lisa are using. It seems that because John used editor1, productivity is hampered. However, this is absolutely the wrong conclusion. It is true that the variance due to the difference is on the shoulders of John; editors could be to blame. However, we also need to consider that both John and Lisa use paper to communicate: notice that in all of the problematic actions, communication is via paper. As a result, you need to cross- reference this factor to successful actions to see if, in those situations also, communication was by paper only.
When you analyze a problematic matrix, the first thing you need to ascertain is not what is different, but what is common. Consider the matrix as a huge algebraic equation where your task is to solve the values of each factor. Because the problematic matrix has more variables than equations, there is no one solution. If we convert Table A.1 in a set of equations, Listing A.2 results.
| |
J + e1 + p + m1 = 30 L + e2 + p + m2 = 25
| |
Assigning values to what is common between all equations, and then assigning numbers to the rest of variables, solves the algebraic equations in Listing A.2.
Table A.2 shows the same matrix as that in Table A.1, with some values assigned.
| Programming | Tools | Communication | Action | Difference |
|---|---|---|---|---|
| John (8) | editor1 (9) | Paper (13) | Implement module 1 | 30 |
| Lisa (6) | editor2 (6) | Paper (13) | Implement module 2 | 25 |
In this version of the matrix, we are looking for the common pieces, and we assign generic values to them. The best way to know which value to assign to the common element is to find the lowest difference value from the Difference column among all common equations and then to assign to the variable half the value. In Table A.2, the lowest common difference is 25, which, when divided by two is 12.5 or 13, and that is then assigned to the variables in the Communication column.
For the rest of the values, assign the variables by taking half of the leftover value and assigning it. For the second row, 25 minus 13 results in 12; dividing this value evenly across all factors results in 6 and 6. This is not extremely scientific, but it provides a way of comparing different factors in a non-discriminatory way. For the first row, that means the values of 8 and 9 are calculated.
If you had another common value between row one and two, then you would assign three- quarters of the lowest difference to each common value. Table A.3 shows a sample matrix with two common attributes for Tools and Communication.
| Programming | Tools | Communication | Action | Difference |
|---|---|---|---|---|
| John (12) | editor1 (9) | Paper (9) | Implement module 1 | 30 |
| Lisa (7) | editor1(9) | Paper (9) | Implement module 2 | 25 |
Once the numbers have been subbed in, the objective is to figure out what went wrong. The way to figure this out is to look at the largest numbers. In the case of Table A.3, John has an associated number of 12. When you look at all of the numbers, this means John is more problematic than the tool he is using to edit the source code file.
When you're reading problematic matrices, it is essential to realize that the numbers are a potential indicator, not the indicator. A problematic matrix makes it simpler to decide what attributes and factors to look at when actions are problematic.
Relation of Debugging Time to Implementation Time
We now need to consider debugging time and implementation time. Architects, designers, and programmers make mistakes, which the QA generally catches. These mistakes have to be fixed until they are written off as fixed. It would therefore seem that the time of implementation and time to write off the action as fixed would be important. However, the truth is that they do not really matter, since fixing a bug might not be a good measure of good coding or bad coding. For example, a bug fix could be a design issue that was not considered when the software project was designed. Therefore, fixing that bug, which worked correctly as per the specification, might make the programmer look like a bad programmer when in fact an architectural issue was to blame.
A better measure of the overall software development process is to track the total bugs raised and total bugs fixed, as shown in Table A.4.
| Total Bugs Raised | Total Bugs Fixed |
|---|---|
|
|
|
| 4 | 1 |
| 9 | 2 |
| 15 | 4 |
| 22 | 7 |
| 32 | 11 |
| 47 | 19 |
| 57 | 28 |
| 62 | 42 |
| 66 | 54 |
| 69 | 64 |
| 69 | 66 |
| 69 | 67 |
| 69 | 68 |
| 69 | 69 |
Do not put too much stock into the exact bug numbers since they are just numbers. What is important is the rows when you relate them to a time. Each row represents a unit in time and the number of bugs raised and bugs fixed. Figure A.1 shows the graphic representation of the data in Table A.4.
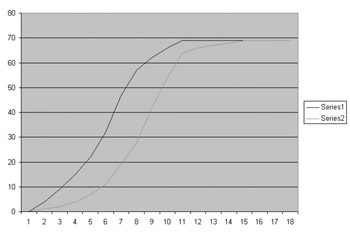
Figure A.1: A graphical representation of the total bugs raised and total bugs fixed statistics.
What you should notice in Figure A.1 that both lines look like a slanted S shape. By default, all software processes follow this slanted S, which has three distinct phases. The first phase from time units 1 to 4 is the ramping -up period , where everybody is becoming used to the system and there are more bugs being generated than fixed. The phase from time units 4 to 9 is called testing and fixing . In the testing and fixing phase, bugs are generated and are being fixed. At this point, everybody is doing their job and the number of bugs fixed equals the number of bugs raised. In this phase, the total number of bugs raised still outnumber the total number of bugs fixed. This is OK and normal. The last phase, from time units 9 to 18, is called the wind-down phase . At this point, the number of bugs raised is not that significant, and the bugs are getting fixed. Notice also that in the testing and fixing phase, the individual graph lines have an inflection point where the number of bugs raised slows down and the number of bugs fixed increases .
The interesting part of the S-graph is that all software development projects follow the graph. Knowing that the S-graph works, you can predict when a piece of software is ready to ship, and you can generate a timeline in the testing phase. However, when presented with these graphs, you need to watch for certain conditions, since Figure A.1 is an idealized graphing. Following are some common problems you can detect using these graphs:
-
The inflection point of bugs raised has not been reached, or it has been reached and another inflection point of more bugs raised is started. The problem in this case is that somebody changed something in the software that is causing the software to generate its own bugs. In other words, people are fixing the same thing or functionality over and over again.
-
In the testing and fixing phase, the distance between the bugs raised and bugs fixed decreases, but the bugs-raised graph does not reach its inflection point. The problem in this case is that the testers are having problems properly testing the software.
-
In the testing and fixing phase, the distance between the bugs raised and bugs fixed increases, and the bugs-raised graph has passed its inflection point. The problem in this case is a potential time bomb. What is happening is that the testers are doing their job, but the developers are slow to fix bugs. This could be because the programmers are slow or because they are struggling to implement the feature set. In either case, there could be an explosion of bugs. And, because the programmers are having problems at this point during the explosion of bugs, things might become entirely chaotic .
-
Neither the bugs fixed nor bugs raised are reaching their inflection point. The problem in this case is that the project is running out of control. The list of bugs keeps increasing, and the programmers are fixing the bugs. But there is no sense of a light at the end of the tunnel. In this case, the problem is probably more related to the overall design. This is because the testers are seeing implementations that are probably correct but incorrectly defined.
EAN: 2147483647
Pages: 109