SETTING THE STAGE
|
|
Figure 2 is a process map showing how customers typically proceeded through the DCS website. Anyone who has shopped on the Internet will recognize that this process is similar to that used by many online stores. Figures 1, 3, 4, and 5 show screenshots corresponding to the four steps highlighted in Figure 2.
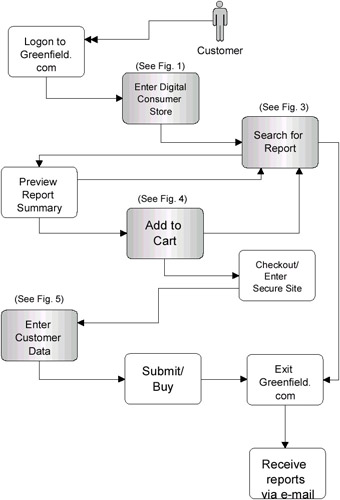
Figure 2: Process Map of Customer Flow Through the Digital Consumer Store
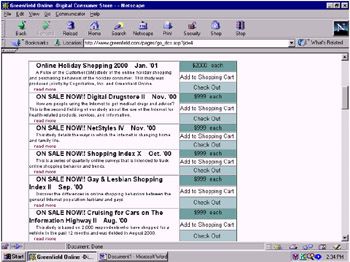
Figure 3: Partial List of Reports Available Through the Digital Consumer Store
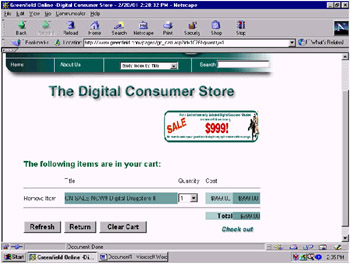
Figure 4: "Add to Cart" Screen
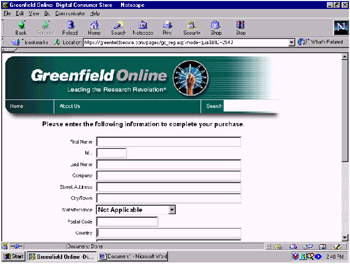
Figure 5: Customer Data Entry Screen
Figures 6 and 7 show Data Flow Diagrams (DFDs) of the order fulfillment and billing processes. The Level 0 Context Diagram in Figure 6 represents data flows between the DCS and three external entities – i.e., the customer, the market research department, and the credit card company. Note that flows to and from the customer in the DFD correspond to a subset of the activities shown on the process map in Figure 2.
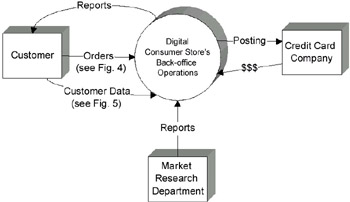
Figure 6: Level 0 Data Flow Diagram of Digital Consumer Store's Back Office
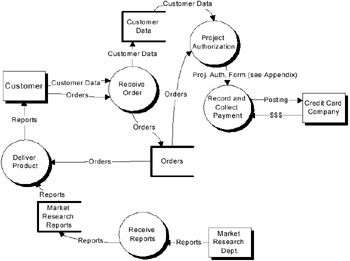
Figure 7: Level 1 Data Flow Diagram
To see back office operations in more detail, the inner workings of the high level process bubble from the Level 0 DFD are presented in the Level 1 DFD shown in Figure 7. Figure 7 breaks the DCS process bubble in Figure 6 into subprocesses and data stores. The Level 1 DFD includes the same external entities (rectangles) and flows to and from those entities that are shown in the Level 0 DFD. The bubbles in the Level 1 DFD represent back office subprocesses, and the three-sided rectangles are data stores. If additional detail were needed (e.g., by a software developer), a Level 2 DFD could be produced for any of the subprocesses shown in Figure 7. With the different levels of detail provided by this hierarchical modeling technique, the DFDs are useful for communications between managerial and technical personnel who are concerned with different aspects of system design and performance.
|
|
EAN: 2147483647
Pages: 367