Taking Baselines
 |
| |||||||||||
| | |||||
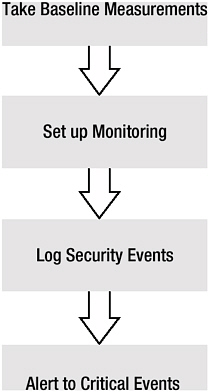
Monitoring begins with documenting the current honeypot system thoroughly. You cannot figure what has changed if you didn’t know what the beginning state looked like. Taking baselines is the first step in honeypot data collection, as illustrated in Figure 10-1.

Figure 10-1: Honeypot data-collection strategy
Real Windows honeypot baselines are obtained by documenting normal disk/file structures, OS activity, objects and their permissions, and network activity.
Begin by documenting all the network settings, IP addresses, MAC addresses, and routing tables. When trying to follow a hacker’s trail, having your honeypot system’s TCP/IP configuration documented and handy will help in the forensic investigation. Document everything you can about each honeypot, including the following:
-
Normal network traffic protocols
-
Normal network and host utilization levels
-
User and computer objects, and their SIDs
-
User login account names and passwords
-
User permissions and privileges
-
User special privileges (user rights assignment) and membership of each
-
Logon and authentication protocols (anonymous, LM, NTLM, and Kerberos)
-
Password and account lockout policies
-
Any IPSec policies (or any other secure channel protocols, like SSL or SMB signing)
-
Disk configuration, file system type, total disk size, number of volumes or partitions, total volume or partition size, free space per volume or partition
-
Files and directories (names, locations, sizes, dates, and MD5 hash)
-
File permissions
-
Registry settings and permissions
-
Groups (local and otherwise), group memberships, permissions, and SIDs
-
Shares and permissions
-
Programs and processes
-
Services (status, startup type, and logon service account name and password)
-
Normal event log messages during operating, startup, and shutdown
-
Programs that automatically run each time the computer starts
-
Any local computer policy or group policy objects (if used)
-
Any machine or user certificates (if used)
If this seems like a lot of information, it is! But without it, finding out what the hacker manipulated or changed could be difficult. Use automated data-collection programs when you can, and manually document only when you must.
Microsoft has plenty of free tools that can help you collect the information listed here. Table 10-1 shows a random sampling of Microsoft tools that you can use to document baseline settings. Most of the tools listed in Table 10-1 are available in Windows 2000 and later, and are installed by default. However, third-party vendor tools often do the job better. This chapter will cover many third-party utilities, along with the Microsoft ones.
| Baseline Attribute | Microsoft Tool |
|---|---|
| Network traffic type and levels | Performance Monitoring, Network Monitor, System Monitor |
| Network settings | Ipconfig.exe, Netsh.exe, Arp.exe |
| Network ports | Netstat.exe |
| Boot configuration settings | Bootcfg.exe /query |
| User and computer objects | Dsquery (in domain environment), Active Directory Users and Computers queries, Net.exe |
| NTFS file and Registry permissions | Cacls.exe, Regedit.exe, Regedt32.exe |
| Shares and permissions | Computer Management snap-in, Dacls.exe, Net.exe |
| User privileges | Group Policy Management Console, Resultant Set of Policy (RSoP) snap-in, Whoami.exe (in 2003 only), Local Security Policy |
| Logon and authentication protocols (anonymous, LM, NTLM, and Kerberos) | Group Policy Management Console, RSoP |
| Password and account lockout policies | Group Policy Management Console, Local Security Policy, Net.exe |
| IPSec policies | Netsh.exe, Ipsecpol.exe, IPSec Microsoft Management Console (MMC) snap-in |
| Disk configuration, file system type, total volume or partition size, used space, free space | Diskpart.exe, Disk Management MMC snap-in, Chkdsk.exe, Fsutil.exe |
| Installed device drivers | Driverquery.exe, Computer Management snap-in |
| Files and directories (names, locations, sizes, dates, signature) | Dir, Sigverif.exe, Windows Explorer, Dacls.exe |
| Groups (local, and otherwise), group memberships, permissions, SIDs | Net.exe, Group Policy Management Console |
| Processes | Task Manager |
| Services (status, startup type, and logon service account name and password) | Net.exe, Group Policy Management Console |
| Normal event log messages during operating, startup, and shutdown | Event Log, Event Viewer, Computer Management snap-in, EventCombMT.exe, LogParser.exe |
| Programs that run automatically each time the computer starts | Msconfig.exe, Dr. Watson (also Sysinternal’s Autoruns.exe, described in the “Monitoring Programs” section in this chapter) |
| Local Computer Policy and Group Policy Objects | Group Policy Management Console, Local Security Policy, GPResult.exe, RSoP, Secedit.exe |
| Digital certificates | Certificates MMC snap-in, Certutil.exe |
| Note | Most baseline programs can also double as monitoring utilities when used to compare original state data against later modifications. |
Host Baselines
There are dozens of free and commercial baseline programs available to document current computer settings and compare them again at a later date for analysis. Here are some of them:
-
Tripwire: This is the most popular host-based program. Although an open-source Tripwire program exists, it works only in the Unix/Linux world. For Windows, there is a commercial version (http://www.tripwire.com). Tripwire takes an initial “snapshot” of your current computer configuration. (Tripwire has predefined areas for snapshots, which you can modify.) Then, at predefined intervals or a manually selected date, Tripwire takes another snapshot. Differences can be reported to the screen or to a myriad of reports. Tripwire does an excellent analysis, and its centralized management, reports, and flexibility have earned it the top host baseline spot.
-
Sysdiff and Windiff: Microsoft offers the free rudimentary Tripwire-like programs, Sysdiff and Windiff. Sysdiff (ftp://ftp.microsoft.com/reskit/win2000/sysdiff.zip) is run once to take a snapshot and another time (after modification) to create a “difference” file. This difference file can be viewed and printed. Sysdiff was created to run on Windows NT and 2000 and can be found in the Resource Kit utilities. Windiff (http://support.microsoft.com/default.aspx?scid=kb;en-us;159214) runs on Windows NT and later and uses a GUI to compare two sets of ASCII or binary files, including Registry files.
Note You can also use Fc.exe and Comp.exe to compare two sets of files on the command line.
-
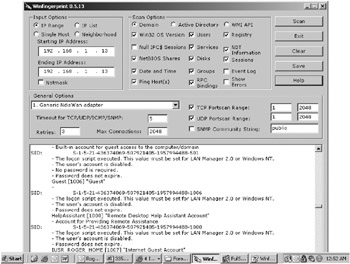
Winfingerprint: This is an excellent open-source host documentation tool for Windows NT and above OSs (http://winfingerprint.sourceforge.net), with an easy to understand GUI (see Figure 10-2). It can list local, domain, or Active Directory resources. You can document a single host or scan a whole network. Winfingerprint creates a single report that contains most of the baseline information you will need. It lists user, computer, and group account names, along with SIDs and permissions. It will do TCP and UDP port scans to report listening services. Running services are listed, along with null sessions, shares, and RPC bindings. NetBIOS shares are checked to see if they can be accessed without a password. It can tell you which machines are configured as domain controllers and which are member servers. It reveals OS versions, network protocols installed, CPU type, and computer names. It will list hotfixes and service packs installed as reported by the Registry (but this information is not always reliable).

Figure 10-2: Winfingerprint in action -
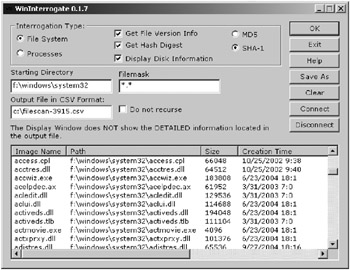
WinInterrogate: This can be downloaded at the same location as Winfingerprint. WinInterrogate scans local (see Figure 10-3) or remote files and processes, and calculates their hash. It identifies files by name, path, file size, creation time, last access, and attributes (not all fields are displayed on the screen). Processes are listed by name and path, process ID, linked DLLs, and port bindings (Windows XP and 2003 only). Files can be scanned over NetBIOS shares, and both files and processes can have their MD5 or SHA-1 hash calculated and recorded. All information can be saved to a CSV file on the disk and later analyzed or printed. Both Winfingerprint and WinInterrogate are great ways to document Windows host baselines. You could run them before and after reports to compare and look for changes during the monitoring stage of your honeypot system.

Figure 10-3: WinInterrogate scanning local files -
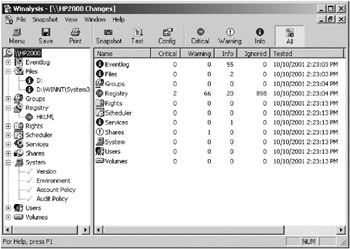
Winalysis: This is a commercial program (http://www.winalysis.com) for taking Windows system snapshots (see Figure 10-4). It can monitor changes to files, the Registry, users, groups, security policies, services, shares, scheduled jobs, the system environment, and more. It can monitor one or more remote machines and report back to a central console. It provides real-time notification of critical events using e-mail, NET SEND, event log messages, scripts, or Simple Network Management Protocol (SNMP) traps. It can restore changed files or Registry keys from compressed snapshots. It even allows you to centralize multiple event logs.

Figure 10-4: Winalysis snapshot comparison screen -
Windows Forensic Toolchest (WFT): This free utility (http://www.foolmoon.net/security/wft/) is a handy, all-in-one mechanism for collecting a comprehensive and forensically sound report. It is essentially a script that runs dozens of other programs that collect system information. The default script includes commands to document information about memory contents, processes, services, OS, users, groups, network configuration, active TCP/IP ports, NetBIOS, shares, open files, open sessions, audit policy, event logs, Registry, autorun programs, hidden files, and more. You can customize which programs and tools the script runs. Each tool used must be verified using an MD5 hash checksum tool, and each finding is output to an HTML report file. The script, along with the related tools, is meant to be executed from read-only media. Initial setup is cumbersome, as each utility must be downloaded separately, checksummed, and added to the configuration file. But once it is configured,WFT is executed with one command and returns a wealth of information. You can run it once to collect baseline information on your honeypot, and again, after the hacker’s compromise to compare results.
| Note | The disk of the honeypot system should have been formatted first before installing the honeypot software or OS. Make sure to do a full format, not a quick format (which just erases file location markers but leaves the old data still on the disk). You want the disk system to be void of all non-honeypot data. This step will make data analysis (discussed in Chapter 11), after the honeypot is compromised, significantly easier. If you forget this step, when you find data on the disk, you might not know what is the new data and what was left on the disk from the computer’s previous use (if the computer was not new). |
Network Baselines
It is important that you get network traffic baselines on your honeynet and each honeypot within the system. You need to know which network traffic characteristics are normal and which are abnormal. Do this by summarizing network utilization over a period of days that are representative of noncompromised behavior. Because this is a honeypot system, network traffic within the honeynet should be nonexistent or minimal. Expect to see some default traffic coming from NetBIOS queries, other Windows network broadcasts, and from normal network device traffic (such as spanning-tree broadcasts from a switch or bridge).
You want to record network traffic volumes and LAN utilization, as well as which network ports are listening for connections on the honeypot. Be sure to note which protocols are used and where traffic originates from and heads to.
Any network traffic analyzer will do, but certainly Ethereal and Snort (covered in Chapter 9) can do the job well. Hardcore fanatics can use the barebones WinDump (http://windump.polito.it) to collect network packets. These packets can then be analyzed by any network traffic analyzer that supports tcpdump-style input files. You can use any of the network monitoring products to trigger an alert action if network traffic is detected on the honeypot system.
You can use an assortment of utilities to collect network baseline data:
-
Netmon: Windows server products come with a Microsoft network traffic analyzer called Network Monitor (or Netmon). Although not installed by default, you can load it through Add/Remove Programs in the Control Panel. Netmon versions installed this way can collect only traffic headed to and from the host(s) on which it is installed. In order to get a promiscuous version, you need to buy Microsoft Storage Management Server (SMS).
-
Performance Monitoring console: To collect long-term summary statistics, you can use the Windows Performance Monitoring console. It offers detailed charts, logs, and counters about dozens of aspects of any Windows system, including network traffic, login failures, and CPU utilization. Starting in Windows 2000, a subset of statistics—network, memory, and CPU—can be collected in System Monitor, which runs when the Performance Monitoring console is started. In Windows XP, Task Manager can also monitor and summarize network utilization. But for long-term analysis, use the Performance Monitoring console.
Tip Windows allows remote monitoring. It is better to run the Performance Monitoring console from a remote machine, so the Performance Monitoring usage on the local computer doesn’t skew the very statistics it is collecting. Also, this ensures that the hacker won’t notice the monitoring utility.
-
Netstat.exe: To list all the active listening ports, you can use the Windows Netstat.exe command. Run Netstat.exe with the -an parameters to list listening TCP and UDP ports. In Windows XP, you can use -ano to enumerate listening ports and tie them back to the PID of the process that opened the port. Windows XP Service Pack 2 added another parameter, -b, which lists the program or process that is listening on the port by name (but not location as well). Unfortunately, it is very slow.
-
Fport and Vision: Foundstone ((http://www.foundstone.com) offers the utilities Fport /index.htm?subnav=resources/navigation.htm&subcontent=/resources/freetools.htm) and Vision (http://www.foundstone.com/index.htm?subnav=resources/navigation.htm&subcontent=/resources/vision.htm) for listing active listening ports.
-
TCPView: Sysinternal’s TCPView (http://www.sysinternals.com/ntw2k/source/tcpview.shtml) is another utility for listing listening network ports.
-
Port Explorer and Open Ports: My personal favorite for listing active listening ports is DiamondCS’s Port Explorer (http://www.diamondcs.com.au/portexplorer) or its open-source option, Open Ports (http://www.diamondcs.com.au/openports).
-
CM: Cambia Security Inc.’s CM product (http://www.cambia.com/product_info.asp) is essentially a Tripwire-like utility for documenting (and monitoring) the network. It first documents existing network devices, IP addresses, and applications. It then detects the appearance of new devices and services, as well as changes to existing devices and services across an entire heterogeneous network. Cambia CM’s detection technology monitors from a single centralized point, without agents or changes to network devices. Alerts can be delivered via SNMP, XML, or e-mail, or to a user-defined executable allowing interoperability with security and network management systems.
| | |||||
EAN: 2147483647
Pages: 119