Graphical indicators allow users to define a set of criteria that defines that a colored image is shown in a field instead of the data the field holds. This feature is commonly used to create "stop light charts " that can show the status of a given field at a glance. In the example of our Remaining Budget field, instead of displaying the remaining budget as a number, we can display a green ball if the remaining Budget value for a task is greater than $5,000, a yellow ball if the value is less than $5,000 but greater than $1,000, and a red ball if the value is less than $1,000. This would immediately draw the eye of the user to any task that has a Remaining Budget value of less than $1,000.
Defining Graphical Indicator Criteria
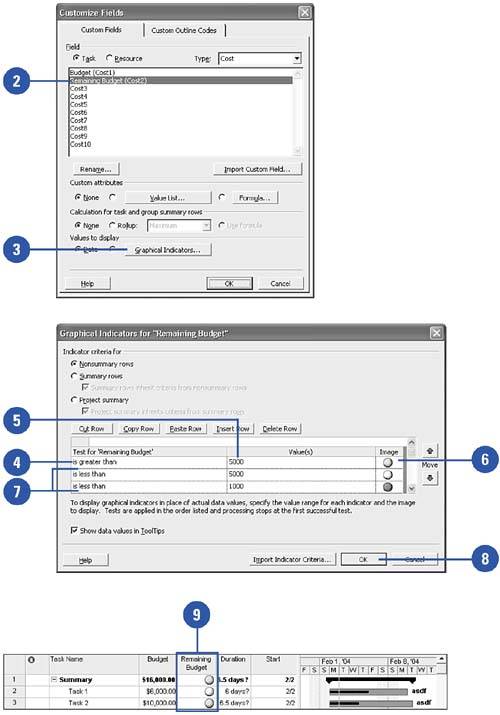
Click Tools, Customize, Fields from the menu bar.
Select the Remaining Budget field in the Customize Fields dialog.
Click the Graphical Indicators button.
In the first row, select Is Greater Than in the Test column.
Enter the number 5000 in the Values column.
Select the green ball from the Image column.
Repeat steps 1 “5 for the second and third rows using the criteria seen in the screenshot.
Click OK.
When the Remaining Budget field is inserted into a view, it will display a red, yellow, or green ball instead of the value it holds.