24.2 How Much Availability? The Elusive "Five 9s" Now that we have an understanding of the challenges ahead of us, we need to sit down with our customers and discuss exactly what they require as far as availability is concerned . We all need to be frank and open in our discussions, because these discussions will lead to a formal or informal Service Level Agreement (SLA). The immediate problem with High Availability is that in measuring it we first need to pin it down. Other metrics for monitoring system utilization usually have a metric that we can monitor on an ongoing basis, and with experience, we can gain insight into the behavior of that metric in the near future, e.g., CPU utilization. All else considered , CPU utilization can be monitored , and if asked, you can answer, "Yeah, everything looks okay." With High Availability, it's a bit different. High Availability, as it is normally calculated and expressed , is always based on historical data.  Availability is simply a snapshot in time that says, " as of now, our availability targets are within acceptable parameters. " It is difficult to predict when an outage is going to happen; that's why we try to mitigate the time it takes to recover from an outage by employing redundancy in our components and resources. The fact that " availability " is expressed as a percentage of uptime in a given year is okay; it's easy for everyone to understand and easy to calculate. Figure 24-3 shows the amount of downtime allowed for common "availability" targets. Figure 24-3. High availability percentages 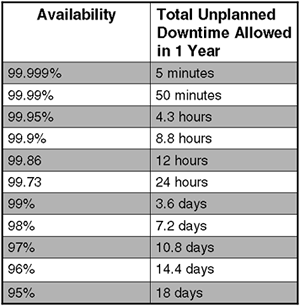
As you can see, to achieve some of the availability targets, we will need to employ several technological innovations in order to meet the expectations of our customers. In 1998, Hewlett Packard management embarked on a program of providing the elusive " five 9s, " i.e., 99.999 percent uptime, in conjunction with major hardware and software vendors , as a measure of overall availability of Hewlett Packard systems. As you can see from Figure 24-3, that will require only 5 minutes of unplanned downtime every year. If it can be achieved, this is an enviable target for any hardware or software vendor to promote. If you can provide " five 9s " availability to your customers, I am sure they will not only be impressed but grateful. There are two other " availability " metrics commonly touted by vendors to indicate the availability of components and resources: -
Mean Time Between Failures (MTBF) : The formal definition of MTBF is " the means of a distribution of product lifetimes, estimated by dividing the total operating time accumulated by a defined group of product, e.g., disk drives , within a given time period, by the total number of failures seen in that time period." This can be somewhat simplified with the following equation: Take disk drives as an example: The MTBF of a disk drive may be 800,000 hours. This means that the " mean time " between failures is 800,000 hours. This can be misleading for some people because they think that there is little likelihood of experiencing a failure during the MTBF period. If this is your impression of MTBF, then you are quite mistaken. MTBF gives you no idea of the distribution of failures over time. The distribution of failures of many components is known as the " bathtub frequency, " as you can see in Figure 24-4. Figure 24-4. Bathtub failure distribution. 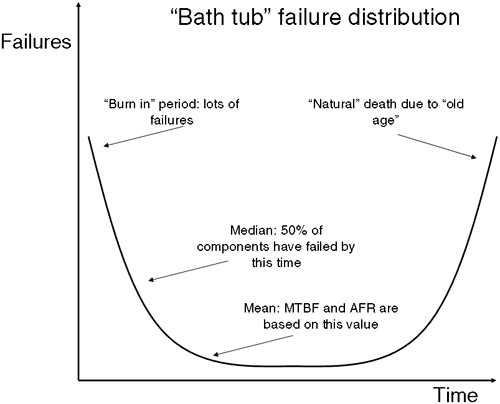 What we see here is a high " infant mortality rate " where components fail early in their lives due to defects, mostly from manufacture, transport, and mishandling during installation. The number of subsequent failures falls as this " burn in " period passes . We then see few failures; the component is working within operating tolerances. As the component reaches the end of its " natural life, " we will see the number of failures rise again. The name " bathtub " comes from the fact the plotted graph line looks like a cross-section taken through a household bathtub. -
Annualized Failure Rate (AFR) : AFR is related to MTBF in that to derive the AFR figure for a device, we simply divide the number of hours in the period (normally one year, hence, " annualized" ) by the MTBF figure. This is normally expressed as a percentage. 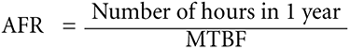 Returning to our disk drive example above, we wan conclude that the AFR for that device = 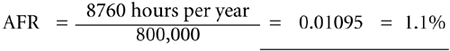 This means that in one year, we are likely to see 1.1 failures per device. It makes sense that failures are independent and cumulative; a failure of one disk has no bearing on whether another disk will fail. Hence, if we have a disk farm of 1,000 disks, we are likely to see 11 disk failures in the space of one year. Like the MTBF figure, this gives no indication of the distribution of failures, but I venture that when trying to " visualize " the failures likely over one year the AFR will give you a better impression of the number of failures than simply looking at the MTBF figure. That's my opinion, but you should make up your own mind. To conclude, we should be able to come up with a statement to define High Availability. Here is one form of that statement: IMPORTANT A system is highly available if a single component or resource failure interrupts the system for only a brief time. |
How you interpret this statement is governed by the motivation you and your organization have toward defining and minimizing what is meant by a " brief time. " |