Monitoring Variables and Expressions
| As you step through a program, you can monitor the running values of fields and local variables in the following ways:
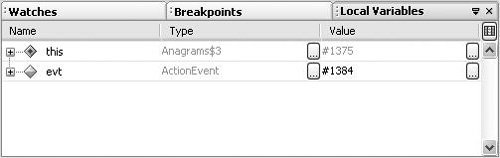
The Local Variables window (shown in Figure 7-6) displays all variables that are currently in scope in the current execution context of the program, and provides and lists their types and values. If the value of the variable is an object reference, the value is given with the pound sign (#) and a number that serves as an identifier of the object's instance. You can jump to the source code for a variable by double-clicking the variable name. Figure 7-6. Local Variables window You can also create a more custom view of variables and expressions by setting watches and viewing them in the Watches window. The Watches window (Alt-Shift-2), shown in Figure 7-7, is distinct from the Local Variables window in the following ways:
Figure 7-7. Watches window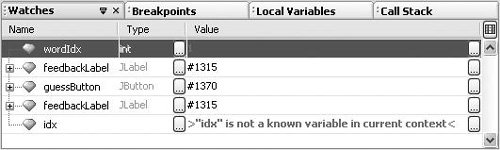 Setting a Watch on a Variable, Field, or Other ExpressionTo set a watch on an identifier such as a variable or field, right-click the variable or field in the Source Editor and choose New Watch. The identifier is then added to the Watches window. To create a watch for another expression:
Monitoring the Object Assigned to a VariableYou can create a so-called fixed watch to monitor an object that is assigned to a variable (rather than the value of the variable itself). To create a fixed watch:
A fixed watch is added to the Watches window with an Displaying the Value of a Class's toString () MethodYou can add a column to the Local Variables and Watches windows to display the results of an object's toString() method. Doing so provides a way to get more useful information (such as the values of currently assigned fields) on an object than the numeric identifier of the object's instance that the Value column provides. To display the toString() column in one of those windows:
Changing Values of Variables or ExpressionsAs you debug a program, you can change the value of a variable or expression that is displayed in the Local Variables or Watches window. For example, you might increase the value of an iterator to get to the end of a loop faster. To change the value of a variable:
Displaying Variables from Previous Method CallsThe Call Stack window displays all of the calls within the current chain of method calls. If you would like to view the status of variables at another call in the chain, you can open the Call Stack window (Alt-Shift-3), right-click the method's node, and choose Make Current. Making a different method current does not change the location of the program counter. If you continue execution with one of the step commands or the Continue command, the program will resume from where execution was suspended. |
EAN: N/A
Pages: 279