Creating Reports and Interpreting Data
The Software Metering tool includes some basic reports and charts that can help you analyze program and license usage data. These can be accessed through the Tools menu in the Software Metering window. The Tools menu contains two wizards that are designed to generate statistical reports: the Report Wizard and the Graph Wizard. Summary data for licensed and unlicensed programs can also be viewed and analyzed through the Summary view window.
![]()
NOTE
You must have defined a default printer, preferably of PostScript quality, for reports and graphs to display correctly. You do not need to actually have the print device installed—unless, of course, you need printed output.
Viewing Licensed and Unlicensed Program Usage
As we've seen, the Summary view window contains two tabs: Licensed and Unlicensed. The Unlicensed tab displays usage data for each instance of a program that is run if it has not been either excluded or registered, including the name, version, and language of the program that was executed; the user that executed the program; the name of the computer on which the program was run; when the program was started; how long the program ran; and how many copies ran.
This list can grow to be quite large, and as we have seen, you can set summarization rules for condensing this data. After summarization has taken place, each instance of a program is rolled into a single entry, which is displayed in the Unlicensed Programs list, as shown in Figure 14-41. In this example, unlicensed programs are monitored for one week, after which data is summarized for each day.
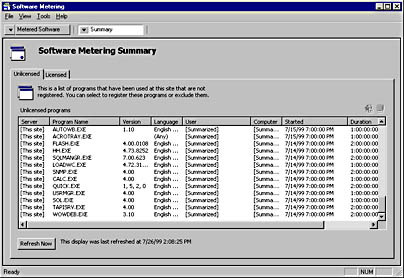
Figure 14-41. Sample Unlicensed Programs list.
Each entry includes the tag [Summarized] to show that summarization has taken place. Unfortunately, the Started and Duration entries reflect the summarization schedule rather than the start and stop times of the program, which would be more useful.
On the Licensed tab, each licensed product is displayed in the Products list, as shown in Figure 14-42. As you select each entry, you can change the data displayed in the right pane by clicking the Reports button (the far right button). Six different report views are available. The default is the Active Summary Of License Use view.
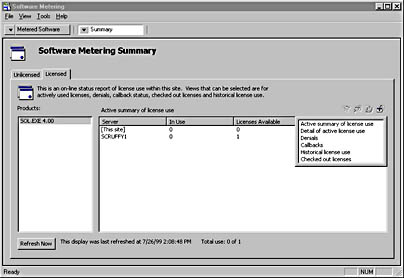
Figure 14-42. Report views available on the Licensed tab.
Table 14-1 lists the six report views.
Table 14-1. Report views for the Licensed tab
| View | Description |
|---|---|
| Active Summary Of License Use | Displays licenses available for balancing at the site server,licenses available at each software metering server, and the number of licenses in use. The number of licenses shown as being in use includes licenses reserved through callbacks. |
| Detail Of Active License Use | Displays the registered products for which a license is currently in use, including the computer and user that are running the program and when it was started. |
| Denials | Displays when the program was denied and which user and computer received the denial. |
| Callbacks | Displays current callback status for this product, including which computers and users have requested or received a callback. |
| Historical License Use | Displays detailed program license usage for the program if summarization rules have not been defined. If they have been defined, displays detailed usage for the summarization age interval defined and summarized entries based on the summarization granularity defined. |
| Checked Out Licenses | Displays current licenses that have been checked out, the user and computer that checked out the license, and the length of time the license is checked out. |
As on the Unlicensed tab, summary data displayed using the Historical License Use report view includes the time and date when summarization occurred.
Report Wizard
The Report Wizard offers 15 different reports, as follows:
- Callback Priority
- Detailed Product Use (Grouped By Product)
- Detailed Product Use (Grouped By User)
- Excluded Programs
- Last Client Run Time Sorted By Age
- Last Client Run Time Sorted By Computer
- Licensed Products
- Multiple Site Summary
- Product Denials
- Single Site Summary
- Software Metering Server Configuration
- Suites
- Total Use of Product (Grouped By Product)
- Total Use of Product (Grouped By User)
- Unlicensed Program Usage
These reports can help to supplement usage data by organizing the information by user, by product, by site, and so on. Figures 14-43 and 14-44 show two examples of reports generated by the Report Wizard. Each report can be printed, resized, or even exported to one of several export formats, such as Crystal Reports, comma-separated values(CSVs), Excel, Word, and a variety of ODBC-compliant formats.
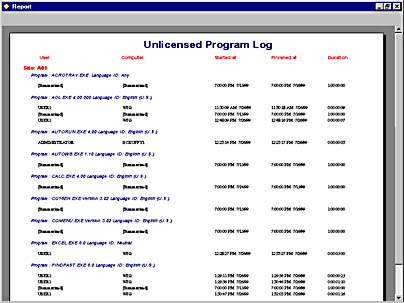
Figure 14-43. Sample Unlicensed Program Log.
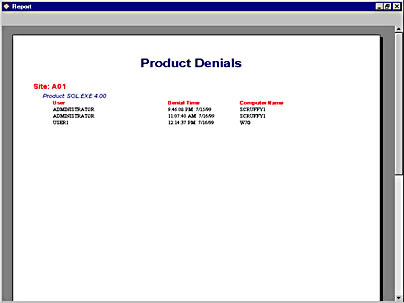
Figure 14-44. Sample Product Denials report.
The Software Metering Server Configuration report is particularly handy for documentation purposes. As shown in Figure 14-45, it gives you an overview of current server settings.
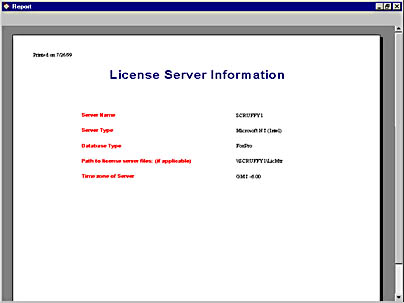
Figure 14-45. Sample Software Metering Server Configuration report.
To generate a report using the Report Wizard, follow these steps.
- From the SMS Administrator Console, start the Software Metering tool.
- Choose Report Wizard from the Tools menu to launch the Report Wizard, shown in Figure 14-46.
- Click Next to display the Available Reports screen, shown in Figure 14-47. Select the report you want to generate from the Available Reports list.
- Click Next to display the Report Range screen, shown in Figure 14-48. Depending on the report you chose, select the appropriate product, site, user, and computer ranges.
- Click Next to display the Date Range screen, shown in Figure 14-49. Enter an appropriate date and time range.
- Click Next to display the Finish screen, shown in Figure 14-50, and click Finish to generate the report and display it.
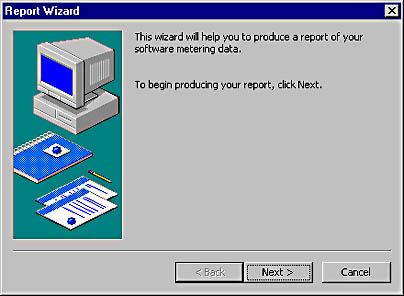
Figure 14-46. The Report Wizard welcome screen.
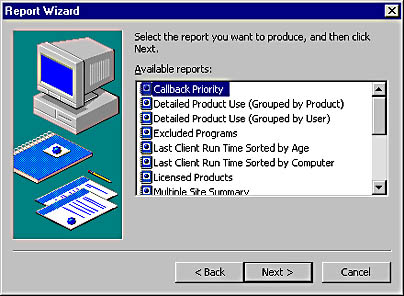
Figure 14-47. The Available Reports screen.
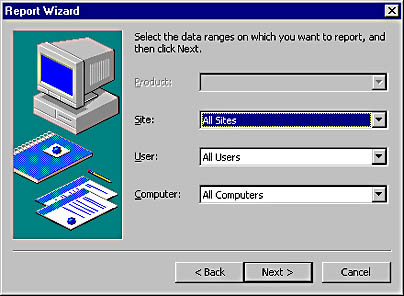
Figure 14-48. The Report Range screen.
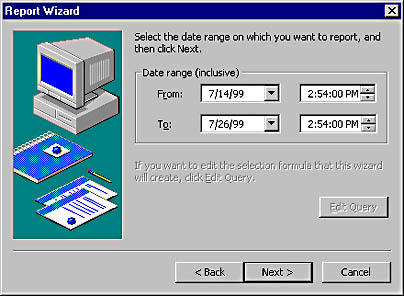
Figure 14-49. The Date Range screen.

Figure 14-50. The Finish screen.
Graph Wizard
The Graph Wizard lets you chart usage data using any of five different graph types, as follows:
- 2-D Bar Graph
- 3-D Bar Graph
- 3-D Perspective Graph
- Area Graph
- Line Graph
These graphs can help to supplement usage data by displaying product usage data by user, by computer, and by site. Figures 14-51 and 14-52 show two examples of graphs generated by the Graph Wizard. Like the reports generated by the Report Wizard, these graphs can be printed, resized, or even exported to a variety of export formats.
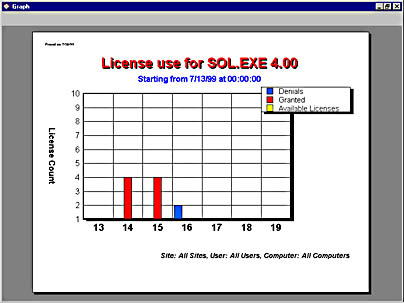
Figure 14-51. Sample 2-D bar graph.
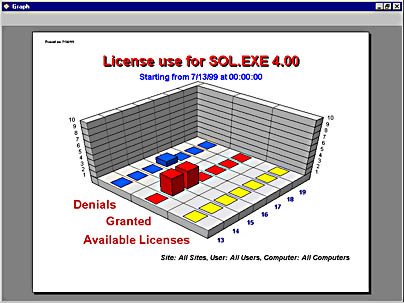
Figure 14-52. Sample 3-D perspective graph.
To generate a graph using the Graph Wizard, follow these steps:
- From the SMS Administrator Console, start the Software Metering tool.
- Choose Graph Wizard from the Tools menu to launch the Graph Wizard, shown in Figure 14-53.
- Click Next to display the Available Graphs screen, shown in Figure 14-54. Select the type of graph you want to generate from the Available Graphs list.
- Click Next to display the Graph Range screen, shown in Figure 14-55. Select the product, site, user, and computer ranges for which you want to generate the graph.
- Click Next to display the Date/Time/Unit screen, shown in Figure 14-56. Enter an appropriate date and time range, as well as the number of units to graph and the time period for each unit.
- Click Next to display the Finish screen, shown in Figure 14-57, and click Finish to generate the report and display it.
Figure 14-53. The Graph Wizard welcome screen.
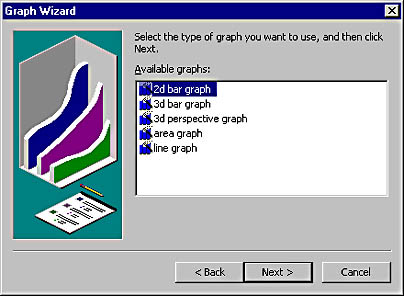
Figure 14-54. The Available Graphs screen.
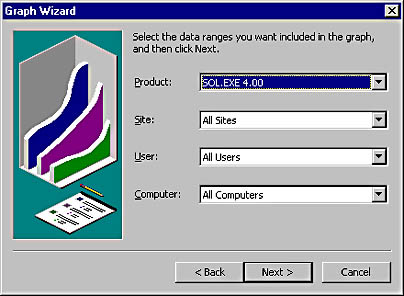
Figure 14-55. The Graph Range screen.
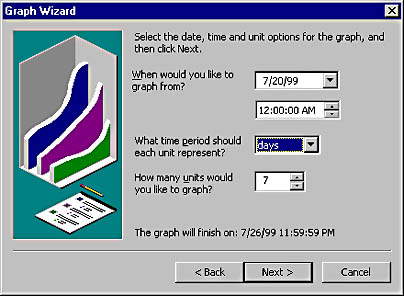
Figure 14-56. The Date/Time/Unit screen.
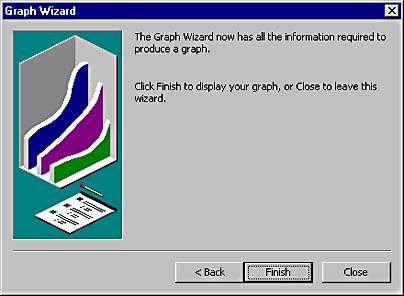
Figure 14-57. The Finish screen.
EAN: 2147483647
Pages: 167