Hack79.Monitor Network Traffic with MRTG
Hack 79. Monitor Network Traffic with MRTG
The Multi-Router Traffic Grapher provides a quick visual snapshot of network traffic, making it easy to find and resolve congestion. There are many reasons it's a good idea to capture data pertaining to your network and bandwidth usage. Detailed visual representations of such data can be incredibly useful in determining the causes of network outages, bottlenecks, and other issues. Collecting such detailed data used to require sophisticated and expensive equipment, but with the advent of Linux and the widespread use of SNMP, we now have a new tool to simplify and expand the possibilities of bandwidth monitoring. This tool is called the Multi-Router Traffic Grapher (MRTG), and this hack shows you how to set it up and use it. 9.3.1. RequirementsMRTG has a few simple dependencies that you may need to fulfill before you dive right into the installation. For starters, you need to have a web server up and running. Apache is typically recommended, but you may be able to get it to work with other web servers. You'll also need Perl installed and working on your system, and MRTG will require three libraries to build its graphs. The first, gd, is used to generate the graphs that make MRTG what it is. The second is libpng, which is used to generate the images of the graphs. Finally, to compress these images, you'll need the zlib library. Download locations for all three of these libraries can be found at the MRTG home page (http://people.ee.ethz.ch/~oetiker/webtools/mrtg/). 9.3.2. InstallationOnce you have the dependencies installed, you can begin the MRTG installation. First, download and untar the source to your build location. Start the MRTG installation with the following command: $ ./configureprefix=/usr/local/mrtg-2 If this produces an error message, you may have to specify where you installed the previously mentioned libraries: # ./configureprefix=/usr/local/mrtg-2 --with-gf=/ path/to/gd\ --with-z=/path/to/z --with-png=/ path/to/png If you need help determining where those libraries were installed, run the following command for each library to find its location: # find / -type fname libpng Once configuration is complete, follow it up with a typical make install: # make && make install The next step is to create the mrtg.cfg file that MRTG will use to determine which devices on your network to query. If you had to create this by hand, things could get a little hairy. Fortunately for us, however, MRTG comes with a command-line configuration tool called cfgmaker that greatly simplifies the creation of the .cfg. Detailed documentation on cfgmaker is available at the MRTG home page, but the following example should be enough to get you started: # cfgmakerglobal 'WorkDir: /path/to/web/root/mrtg' \ --output=/etc/mrtg.cfg \ --global'Options[_]: bits, growright' --output=/etc/mrtg.cfg \ SNMP-community-name@address.router1 \ SNMP-community-name@address.router2 \ Global 'Options[_]: bits, growright' --ifref=descry \ --ifdescr=alias SNMP-community-name@address.switch.1 This will create the configuration file /etc/mrtg.cfg, which will tell MRTG to create bandwidth graphs for router1, router2, and switch1. The graphs will use bits as the primary measurement on the y-axis and will grow toward the righthand side. Theglobal options add entries that apply to this configuration as a whole, while those that are not specified as global apply only to the devices in which we specify them. The location of the configuration file to create is specified by theoutput option. With a valid config file in hand, we can now run MRTG for the first time. Each time you run MRTG, you'll need to specify the location from which you want it to read the config file. Also, unless you've added it to your path, you'll need to type out the full path to the executable. # /usr/local/bin/mrtg-2/bin/mrtg /etc/mrtg.cfg You will see some errors the first two times you run MRTG, but pay them no mindit's simply complaining because it can't find any previous MRTG data. After running the command, your MRTG web root should be filled with PNG files. This is great, except it's a pain to look at them like this, and they're not exactly labeled in a human friendly format. The solution to this problem can be found in the indexmaker tool. indexmaker works just like the cfgmaker tool, only instead of generating config files, it generates an HTML template with which we can display our MRTG graphs: # indexmakeroutput=/path/to/web/root/index.html \ title="My Network MRTG"sort=title This will create an index.html file that sorts and displays our data in a much more user-friendly format, as shown in Figure 9-1. You can then modify the index file just as you would any HTML file to make it display any other information you wish. Figure 9-1. Network traffic graphs created from MRTG data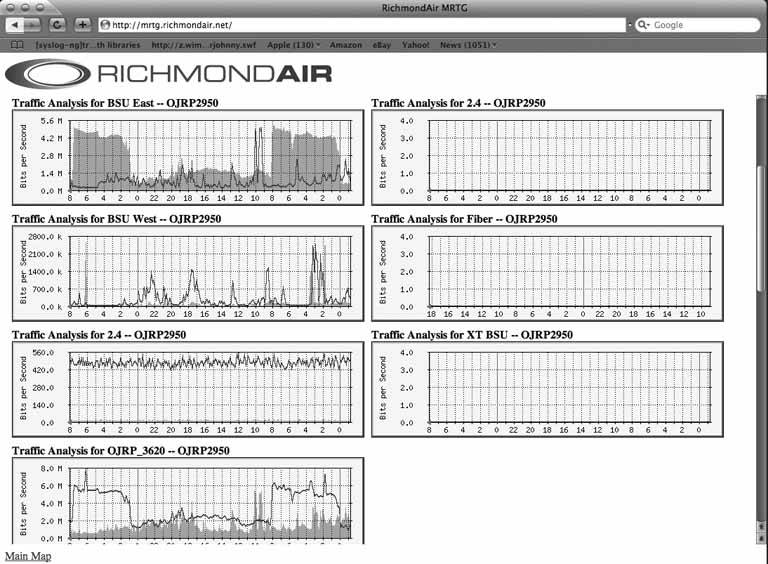 9.3.3. Automating MRTGThe only thing left to do is to automate the process. MRTG wouldn't be very useful if you had to start it manually every time, so we'll have to automate it by adding it to cron. Add the following entry to root's crontab to run MRTG every five minutes: */5 * * * * /usr/local/mrtg-2/bin/mrtg /etc/mrtg.cfg \ --logging /var/log/mrtg.log Don't get impatient waiting to see your pretty new graphs. It will take a day or so for them to begin displaying truly useful data. Once you've had them running for a while, though, you'll be able to pick out all kinds of useful trends in your bandwidth utilization. For instance, you might notice that your bandwidth tends to spike between 8:30 and 9:00 A.M., and then again after lunch. This will help you better understand the utilization of your network, and in turn better serve it. It can be fascinating to simply watch your bandwidth utilization materialize, and then use the information to track and follow trends in network activity. MRTG will create yearly graphs as well as hourly, monthly, and daily graphs. Having such detailed information at your fingertips can help you understand just how much traffic you gained after your web site was Slashdotted, and how your popularity increased even after the story ran. MRTG has a million uses, and they're not just limited to tracking bandwidth utilization. With a little modification, you can use it to measure almost anything you want. For more information on modifying MRTG to display other statistics, see the MRTG home page. 9.3.4. See Also
Brian Warshawsky |
EAN: 2147483647
Pages: 162