| Underutilization describes a system unable to reach full CPU utilization. Let's review the common symptoms of this problem. -
Client and server machines in your test systems never reach their full CPU utilization, regardless of how much you increase the user load. -
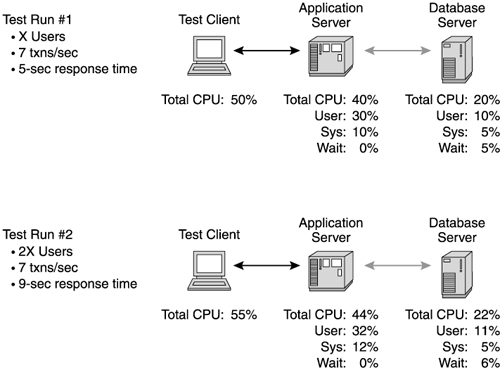
The response time increases as you add users, while the throughput remains the same or maybe even starts to decrease. For example, Figure 13.1 shows Test Run #1 with CPU utilization on the client, application server, and database server all under 50% utilization. In Test Run #2, the client load doubles; however, CPU utilization remains low on all the systems, throughput remains unchanged, but response time increases significantly. Figure 13.1. Underutilization example. From "Experiences with Successful Website Performance Testing," presented by Stacy Joines at the Solutions 2001 conference, San Francisco, CA. IBM Corp. 2001. Reprinted by permission of IBM Corp.  Underutilization appears frequently in performance testing, and indicates one of two problems: -
A bottleneck due to an overloaded resource elsewhere in the system (network, database, test driver, and so on) -
Serialization within the system or the application Let's examine some of the more common causes of underutilization. Insufficient Network Capacity The network acts as a synchronization point if it cannot transfer the full volume of traffic generated by the load. We see this problem frequently if the web site returns much larger pages than originally anticipated during the network design phase. How to Diagnose -
First, get a feel for the actual page sizes the web site returns. Review the calculations in Chapter 9, and verify (on paper, at least) the traffic volumes moving over the web site. -
If you have a network protocol analyzer, place it on the network to verify the data volumes during the test. (Remember to verify permission to do so first.) -
If a network protocol analyzer is not an option, use the netstat command described in Chapter 12 to estimate the data carried by the network. How to Resolve -
If your network is overwhelmed, you need to increase network capacity. Upgrade the network to support the traffic volume. -
Reduce the amount of data moved across the network. This might include reducing large static elements such as gifs and jpegs on your pages. However, this usually only provides temporary relief. As your traffic volumes increase, you'll need more network volume. -
Modifying the test scripts sometimes provides another temporary solution. If you want to keep testing while waiting for your network upgrade, you might remove large static elements from your test scripts and only interact with the dynamic portions of the web site. Again, this provides limited, temporary value for your overall testing. Do not apply the results from this type of testing to your production web site. Application Serialization We discussed in Chapter 4 some of the synchronization points you might find in your application. Web application synchronization forces the multiple threads running the web application to wait in line to enter the synchronization block. Depending on the size of the synchronization block, this might effectively force a multi-threaded web site into single-threaded operation. How to Diagnose Obtain a thread trace of the running web application under load. [1] The thread trace allows you to view what each thread in the web application is doing. Use the thread trace to determine if your applications threads are stalled. See Chapter 12 for more details. [1] On some JVMs, obtaining a thread trace might cause the JVM to fail. Obtaining a thread trace almost always results in a noticeable degradation in system performance. Use this technique with great caution on production systems. How to Resolve Remove the synchronization point or reduce the size of the synchronized block in your application. Insufficient Resources Is your application starving? We discussed above how an overloaded network "starves" your system of incoming load. Likewise, back-end serialization starves your system of data needed to satisfy user requests . Poorly tuned back-end resources, or insufficient resource pools, often cause underutilization. How to Diagnose -
A thread dump gives the best information about this condition. The threads in the application server appear in the thread dump waiting for a back-end resource. They may be stalled inside an LDAP call, for example, or waiting for a database connection. -
Use analysis tools to help you see the state of the web application server. As we discussed in Chapter 12, the IBM WebSphere Application Server provides a Resource Analyzer tool to help administrators monitor key resources like database connection pools. Key indicators include observing all of a pooled resource in use or threads waiting to obtain a resource. -
Observe the performance of remote resources and capture trace data for your application. How long does it take for the host database to respond to a query? Is a mid- tier database running at 100% CPU? Does the DBA see excessive table scans in the application database? As we discussed in Chapter 9, poor performance on a back-end server impacts the entire web site. Make sure you monitor all of the servers and systems involved in your web site. You may find one or more suffering from unnoticed overutilization. How to Resolve -
Fix any performance problems at back-end systems. If your database requires better indices, more CPU, or extra disk platters, add them. After resolving a back-end bottleneck, retest the system without adding more pooled resource (such as database connections). If the back-end system speeds up, the resources return to the pool more quickly. This makes them available more quickly for the next requestor . For example, we've seen database connection usage drop from 20 simultaneous connections to 2 simultaneous connections after tuning the database. -
If the back-end system seems to be tuned properly, try increasing the pooled resource available. Again, if your back-end system is not tuned properly, adding more access points to this resource only makes things worse . Insufficient Test Client Resource Insufficient test client hardware cannot drive your test environment to full utilization. That's why we strongly recommend monitoring your test client hardware throughout the testing. How to Diagnose -
Check your test clients for high CPU utilization. If utilization on any client exceeds 75%, you probably need more client hardware. -
Review the access logs on your HTTP servers or a thread trace from your application server. If the logs show a low number of incoming requests, this also indicates a potential test client problem. This is also true if the thread trace shows few active threads. How to Resolve Fix any performance problems with the test clients. Add additional test client hardware as required. Look for options to reduce the test client CPU requirements such as performing less verification or less logging. Scalability Problem If you use very large multiprocessor boxes, underutilization, rather than being a symptom of a problem, might be normal behavior, given the current configuration. As we discussed in detail earlier, in some cases a single JVM cannot use all of the CPU capacity of a large multiprocessor box. In this case, you might require more than one JVM to take advantage of most of the processing power of the server. How to Diagnose -
Only consider scalability as the cause of an underutilization problem if the server contains many processors (at least 12 CPUs). Small to mid- sized servers do not suffer from significant underutilization problems. -
Perform a vertical scalability test on your server, as described in Chapter 11. If your server reaches full utilization with fewer processors, but is underutilized with many processors, you may have a scalability problem. How to Resolve Try adding more JVMs to run your web application. Many application servers support starting additional instances of the application server on the same machine, or across multiple machines. See your application server documentation for specific information on configuring multiple instances. |
