Java Monitoring
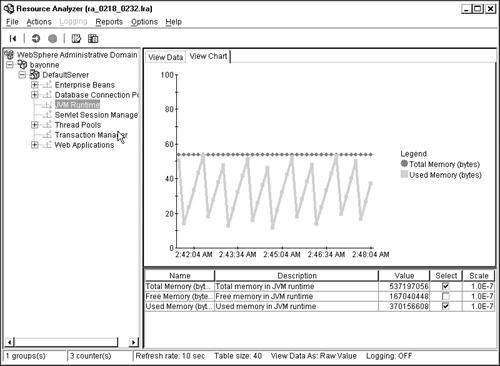
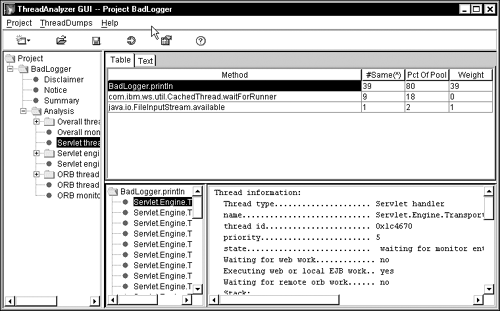
| Many operating systems provide a large array of tools to monitor running applications. Sadly, Java applications rarely benefit from these tools because they run inside yet another "machine" ”the Java Virtual Machine process running on the system. The JVM remains impenetrable to most operating system level tools. So we look to other tools to help us look inside the JVM. Verbose Garbage CollectionAt least at the early phases of your testing, monitor your JVM heapsize carefully . Also take note of how frequently the JVM garbage collects and how many objects it frees during each collection. As we discussed earlier, constant heap growth indicates a memory leak. Likewise, frequent garbage collections involving the recovery of lots of objects point to poor object management within the application. Some web application server vendors, as well as some test tool vendors , provide graphical tools for monitoring the JVM during your performance test. For example, Figure 12.3 shows JVM heap dynamics using IBM's WebSphere Application Server Resource Analyzer tool. This figure shows garbage collection dynamics on a run with a 512MB heap. As the chart shows, garbage collection reclaims most of the heap memory, and there is no increasing memory acquisition trend to indicate a memory leak. Figure 12.3. Sample JVM heap monitor. IBM Corp. 2002. Reprinted by permission of IBM Corp. Graphical tools are useful for identifying problems. However, the “ verbosegc JVM option provides the most detailed information available on garbage collection. The trace produced by this option gives you details about each garbage collection generally not available through a graphical interface. Verbosegc causes the JVM to write out statistics on each garbage collection to stderr . (Many application server vendors capture stderr in a file.) These stats give you the details as to the frequency and duration of the garbage collection. They also tell you how much memory the garbage collection recovered and how many objects it reclaimed. By analyzing the garbage collections over the course of a test run, you get insight into how well the application manages memory. Listing 12.1 contains a subset of a verbosegc output. [2] This particular snippet comes from the fourth garbage collection during a test run. The first line shows the previous allocation failure was 37 seconds prior; also you see this garbage collection cycle completed in just over 1 second. We conclude from this snippet that garbage collection does not present a problem at this point in the test run. (Garbage collection takes a very small percentage of the overall test time.) The log also contains detailed data on the bytes freed and the percentage of the heap free.
Listing 12.1 Sample verbosegc output (highlighting provided for readability)<AF[4]: Allocation Failure. need 8208 bytes, 37063 ms since last AF> <AF[4]: managing allocation failure, action=1 (81352/533723648) (3145728/3145728)> <GC(4): mark stack overflow> <GC(4): GC cycle started Mon Feb 04 11:47:06 2002 <GC(4): freed 378953424 bytes, 71% free (382180504/536869376), in 1261 ms> <GC(4): mark: 1192 ms, sweep: 69 ms, compact: 0 ms> <GC(4): refs: soft 0 (age >= 32), weak 0, final 17027, phantom 0> <AF[4]: completed in 1263 ms> By contrast, Listing 12.2 shows the garbage collection behavior much later in the same run. In this log, we find that the time between memory allocation failures falls from 37 seconds to just 3 seconds. (A memory allocation failure indicates no more memory available in the heap and triggers a garbage collection.) In addition, the garbage collection cycle takes longer and frees far less memory. Listing 12.2 Sample verbosegc output with memory leak occurring (highlighting added for readability)<AF[331]: Allocation Failure. need 8208 bytes, 3391 ms since last AF> <AF[331]: managing allocation failure, action=2 (356680/536869376)> <GC(473): mark stack overflow> <GC(473): GC cycle started Mon Feb 04 13:19:01 2002 <GC(473): freed 34127696 bytes, 6% free (34484376/536869376), in 3155 ms> <GC(473): mark: 3109 ms, sweep: 46 ms, compact: 0 ms> <GC(473): refs: soft 0 (age >= 32), weak 0, final 1556, phantom 0> <AF[331]: managing allocation failure, action=3 (34484376/536869376)> <AF[331]: managing allocation failure, action=4 (34484376/536869376)> <AF[331]: clearing all remaining soft refs> <GC(474): mark stack overflow> <GC(474): GC cycle started Mon Feb 04 13:19:04 2002 <GC(474): freed 311384 bytes, 6% free (34795760/536869376), in 3101 ms> <GC(474): mark: 3055 ms, sweep: 46 ms, compact: 0 ms> <GC(474): refs: soft 9 (age >= 32), weak 0, final 2, phantom 0> <GC(475): mark stack overflow> <GC(475): GC cycle started Mon Feb 04 13:19:07 2002 <GC(475): freed 120 bytes, 6% free (34795880/536869376), in 3103 ms> <GC(475): mark: 3056 ms, sweep: 47 ms, compact: 0 ms> <GC(475): refs: soft 0 (age >= 32), weak 0, final 0, phantom 0> <AF[331]: completed in 9368 ms> This listing shows us either an application with a woefully insufficient heap setting or an application with a memory leak. In this case, a memory leak actually caused the memory problems in the test run. After you reach steady state, if verbosegc output shows a pattern of more frequent garbage collections, with less memory being freed in each GC cycle and a smaller percentage of free heap, profile your application for memory leaks. Verbosegc generates little additional performance overhead. Many customers choose to enable verbosegc throughout their test phase with little impact to their systems. We do, however, recommend running with and without this feature enabled to verify its benign nature in your test environment. We also recommend removing it in production. Thread TraceThread traces give you a snapshot of thread activity inside the JVM. We use these all the time on systems with potential bottlenecks. The snapshot shows us all of the servlet threads waiting inside the JVM for a slow remote system or queuing for a synchronization point. The thread trace provides valuable information about the work occurring inside a JVM. The thread trace, however, impacts system performance. Obtaining a trace slows the JVM to a crawl, so do not use the performance measurements from the run you used to generate the trace. If you suspect an application bottleneck, setting up a run to obtain one or more thread traces often helps you find the problem. To obtain a thread trace, issue the following command from a UNIX command prompt: kill 3 <pid> where pid is the process ID of the JVM you want to analyze. (Some web application servers run multiple JVMs, so make sure you select the correct JVM!) The resulting trace may wind up in a variety of places depending on the operating system: in the current directory, inside the stderr or stdout files, or in a working directory. (On Windows systems, use Dr. Watson to trigger the thread dump.) The resulting file contains a series of thread traces like the one shown in Listing 12.3. Listing 12.3 Sample thread trace output2: "Servlet.Engine.Transports:75" daemon prio=5 tid=0x5b3a50 nid=0x1f1 waiting for monitor entry [0xebb80000..0xebb819e0] 3: at BadLogger.println(BadLogger.java:61) 4: at BadLogger.printlnDetail(BadLogger.java:36) 5: at HitCount.service(HitCount.java:107) 6: at javax.servlet.http.HttpServlet.service(HttpServlet.java:853) 7: at com.ibm.servlet.engine.webapp.StrictServletInstance.doService (ServletManager.java:827) 8: at com.ibm.servlet.engine.webapp.StrictLifecycleServlet._service (StrictLifecycleServlet.java:159) 9: at com.ibm.servlet.engine.webapp.ServicingServletState.service (StrictLifecycleServlet.java:306) 10: at com.ibm.servlet.engine.webapp.StrictLifecycleServlet.service (StrictLifecycleServlet.java:106) 11: at com.ibm.servlet.engine.webapp.ServletInstance.service (ServletManager.java:472) 12: at com.ibm.servlet.engine.webapp.ValidServletReferenceState.dispatch (ServletManager.java:1012) 13: at com.ibm.servlet.engine.webapp.ServletInstanceReference.dispatch (ServletManager.java:913) 14: at com.ibm.servlet.engine.webapp.WebAppRequestDispatcher.handleWebApp- Dispatch (WebAppRequestDispatcher.java:499) 15: at com.ibm.servlet.engine.webapp.WebAppRequestDispatcher.dispatch (WebAppRequestDispatcher.java:278) 16: at com.ibm.servlet.engine.webapp.WebAppRequestDispatcher.forward (WebAppRequestDispatcher.java:105) 17: at com.ibm.servlet.engine.srt.WebAppInvoker.doForward (WebAppInvoker.java:67) 18: at com.ibm.servlet.engine.srt.WebAppInvoker.handleInvocationHook (WebAppInvoker.java:123) 19: at com.ibm.servlet.engine.invocation.CachedInvocation.handleInvocation (CachedInvocation.java:67) 20: at com.ibm.servlet.engine.invocation.CacheableInvocationContext.invoke (CacheableInvocationContext.java:106) 21: at com.ibm.servlet.engine.srp.ServletRequestProcessor.dispatchByURI (ServletRequestProcessor.java:125) 22: at com.ibm.servlet.engine.oselistener.OSEListenerDispatcher.service (OSEListener.java:315) 23: at com.ibm.servlet.engine.http11.HttpConnection.handleRequest (HttpConnection.java:60) 24: at com.ibm.ws.http.HttpConnection.readAndHandleRequest (HttpConnection.java:313) 25: at com.ibm.ws.http.HttpConnection.run(HttpConnection.java:242) 26: at com.ibm.ws.util.CachedThread.run(ThreadPool.java:122) In this version of the IBM WebSphere Application Server, the application server names threads available for running servlets or JSPs as follows : "Servlet.Engine.Transports" Notice that the trace associated with the thread gives the code statement executing on the thread at the time we took the trace. The thread dump contains a trace like the one in Listing 12.3 for each thread executing in the JVM. (We've included only a snippet here for the sake of brevity. An actual thread trace usually includes hundreds of lines.) Review the dump for activity patterns, such as many threads executing the same code statement. Another common bottleneck pattern shows multiple threads waiting for an SQL statement to finish executing, thus indicating a poorly tuned database or a network problem. Sometimes a thread trace shows us what's not happening in your JVM. If you consistently see underutilization of your application server, the thread trace sometimes shows many idle threads! This indicates a bottleneck before the application server rather than behind it. In these cases, look at the test clients , HTTP servers, routers, networks, and other equipment preceding the application server in the test environment. You cannot expect the application server to function at full capacity if you cannot deliver requests to it. The IBM WebSphere Application Server provides the Thread Analyzer tool to assist in viewing thread dumps. Figure 12.4 shows an example thread dump using this tool. In this example, the dump shows 39 threads, all in the same BadLogger.println() method. [3] This indicates a likely bottleneck caused by over-synchronization in the application logging routine. Chapter 13 provides examples of when to use thread dumps to help resolve bottlenecks. Keep in mind that the trace is a snapshot. You might require several traces to give you a feel for any trends in the data. However, for each snapshot you take, restart your JVM and restart your test.
Figure 12.4. Sample Thread Analyzer screen capture. IBM Corp. 2002. Reprinted by permission of IBM Corp. Warning: We recommend using great care when obtaining a thread trace against a production system. Sometimes taking the trace causes the JVM to fail. In all cases, the trace slows the JVM, and it may leave some applications in an uncertain state after it completes. If at all possible, avoid taking a production thread trace; instead, use a test environment. |
EAN: 2147483647
Pages: 126

