|  One of the features you can use to create a simple report in Access is the AutoReport Wizard , which arranges data in a selected table or query as a formatted report. The AutoReport: Columnar Wizard displays each record's data vertically, while the AutoReport: Tabular Wizard displays the data for each record horizontally. You can also create a report using the Report Wizard , which allows you to select the fields and information you want presented and to choose from available formatting options that determine how the report will look. Create and Save a Report Using the AutoReport Wizard -
 | In the Database window, click Reports on the Objects bar, and then click New. | -
 | Click AutoReport: Columnar (to display records in a column), or click AutoReport: Tabular (to display records in rows). | -
 | Click the list arrow, and then click a table or query on which to base the report. | -
 Click OK. Click OK. Access displays the form in Print Preview, but you can switch to Design view, save, print, or close the report. -
 | Click the Save button, type a name for your report, and then click OK. | 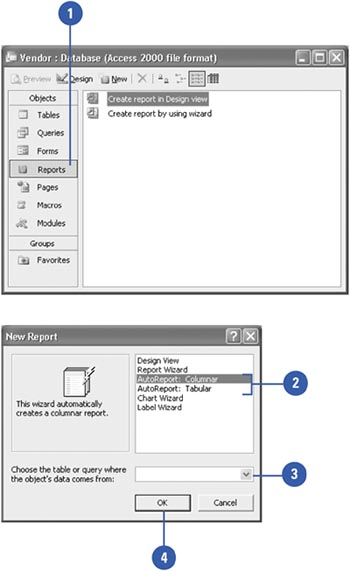 Did You Know? You can create an instant report with the AutoReport command . In the Database window, select the table or query that contains the data you want formatted as a report. Click the Insert menu, and then click AutoReport. After a moment, Access generates a simple columnar report without headers or footers. |
Create and Save a Report Using the Report Wizard -
| | In the Database window, click Reports on the Objects bar, and then double-click the Create Report By Using Wizard icon. | -
| | Click the list arrow for choosing a table or query on which to base the form, and then click the name of the table or query you want. | -
| | Select the fields you want to include, indicating the source of any fields you want to include from other tables or queries. Click Next to continue. | -
| | If necessary, specify any groupings of the records, choosing any or all of the selected fields (up to ten). Click Next to continue. | -
| | Specify the order of records within each group , sorting by up to four fields at a time, and then specify ascending or descending order. Click Next to continue. | -
 | Determine the layout and orientation of your report. Click Next to continue. | -
 | Specify the style of the report, which affects its formatting and final appearance. Click Next to continue. | -
 | In the final wizard dialog box, name your report, and then indicate whether you want to preview the report or display it in Design view. Click Finish. | 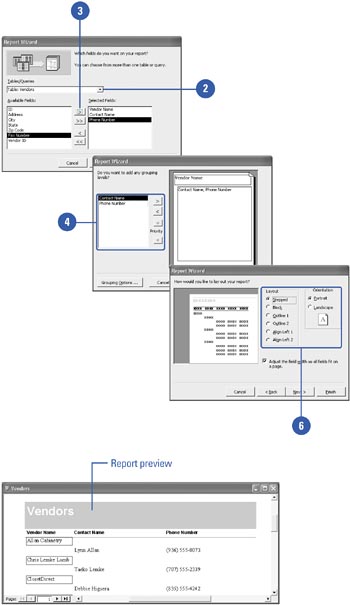 |