Results of the Written Test Survey
|
|
The results presented here were taken from a sample of 657 written test surveys. In some cases, the results of surveys administered in the United Kingdom are presented separately from the results of the U.S.-administered surveys.
Composition of the Respondents
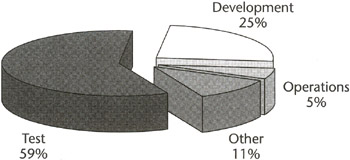
Figure B.1: Composition of respondents by department.
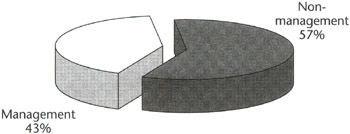
Figure B.2: Composition of respondents, management or nonmanagement.
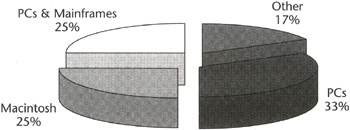
Figure B.3: Composition of platforms tested by respondents.
"Other systems," noted as 17 percent of the total, includes specialized computer systems and subsystems such as those found in car braking systems, telephone switching equipment, pagers, and medical diagnostic equipment.
Education
Of all respondents, 47 percent had some previous training in software testing. For respondents from the United Kingdom, 60 percent had previous test training-on average, 22 months before the current seminar. For the respondents from the United States, only 40 percent had received training, generally within the previous 12 months.
Test Activities
The bar chart in Figure B.4 shows the most and least common test activities as reported by the respondents. System testing was reported to be the primary focus of most of the respondents, with function and integration the next most common types of testing performed by the respondents. User acceptance and unit testing were the focus of the fewest testers responding to the survey.
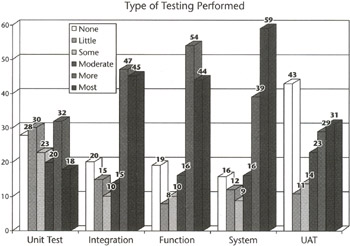
Figure B.4: Type of testing performed by respondents.
Types of Metrics Used
Very few respondents reported using any metrics at all. Lines of code and percent function coverage were the two most used metrics cited by survey respondents. Function points, cyclomatic complexity, and Halstead's metrics were used only rarely (see Figure B.5).
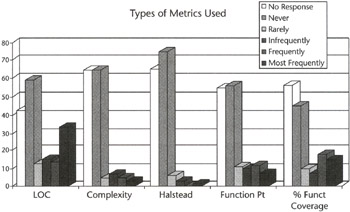
Figure B.5: Test metrics used by respondents.
Types of Formal Methods Used
Few respondents reported using formal methods such as inspection or structured analysis. In fact, the most commonly cited reason for attending the seminar was to learn formal software testing methods.
Test Automation
Test automation elicited great interest in 1994 and 1995. Of particular interest to 69 percent of all respondents were automated script replay and test tracking. The majority of respondents (76 percent) had some experience with automated test tools. Most of the tools listed by respondents were used by only one respondent. The largest group (29 users) used proprietary tools. Of the most frequently named commercial offerings, nine reported using Autotester; eight used SQA Test Tools, QA Automator, or Mercury Interactive's XRunner, and four reported using Microsoft Test.
Knowledge of Common Test Terms
The respondents from the United Kingdom and Europe scored consistently higher than respondents from the United States in defining the 13 test terms. The average score for the respondents from the United States ranged from 30 percent to 60 percent correct. The average score for the respondents from the United Kingdom and Europe ranged from 40 percent to 80 percent correct. The average scores for the definitions of the most commonly performed types of testing-system test, integration test, and function test-were markedly lower among respondents who claim to perform these tasks frequently or most frequently than among respondents who do not claim to perform these tasks. This trend was consistent across all groups from the United Kingdom, Europe, and the United States. This runs contrary to the expectation that the people doing the work would also be the most knowledgeable about the work.
Recognized Survey Deficiencies
The written survey did not ask how long the respondent had been testing or if test coverage, test effectiveness, and test performance metrics were in use. Nor did it ask specific questions about the type of bug-tracking metrics being used, such as the bug-find and bug-fix rates. These questions were added to the seminars in 1994 by way of a voice survey. They were added to the written survey in 1995.
|
|
EAN: 2147483647
Pages: 132