What to Measure in Software Testing
|
|
Measure the things that help you answer the questions you have to answer. The challenge with testing metrics is that the test objects that we want to measure have multiple properties; they can be described in many ways. For example, a software bug has properties much like a real insect: height, length, weight, type or class (family, genus, spider, beetle, ant, etc.), color, and so on. It also has attributes, like poisonous or nonpoisonous, flying or nonflying, vegetarian or carnivorous.[1]
I find that I can make my clearest and most convincing arguments when I stick to fundamental metrics. For example, the number of bugs found in a test effort is not meaningful as a measure until I combine it with the severity, type of bugs found, number of bugs fixed, and so on.
Several fundamental and derived metrics taken together provide the most valuable and complete set of information. By combining these individual bits of data, I create information that can be used to make decisions, and most everyone understands what I am talking about. If someone asks if the test effort was a success, just telling him or her how many bugs we found is a very weak answer. There are many better answers in this chapter.
Fundamental Testing Metrics: How Big Is It?
Fundamental testing metrics are the ones that can be used to answer the following questions.
-
How big is it?
-
How long will it take to test it?
-
How much will it cost to test it?
-
How much will it cost to fix it?
The question "How big is it?" is usually answered in terms of how long it will take and how much it will cost. These are the two most common attributes of it. We would normally estimate answers to these questions during the planning stages of the project. These estimates are critical in sizing the test effort and negotiating for resources and budget. A great deal of this book is dedicated to helping you make very accurate estimates quickly. You should also calculate the actual answers to these questions when testing is complete. You can use the comparisons to improve your future estimates.
I have heard the following fundamental metrics discounted because they are so simple, but in my experience, they are the most useful:
-
Time
-
Cost
-
Tests
-
Bugs found by testing
We quantify "How big it is" with these metrics. These are probably the most fundamental metrics specific to software testing. They are listed here in order of decreasing certainty. Only time and cost are clearly defined using standard units. Tests and bugs are complex and varied, having many properties. They can be measured using many different units.
For example, product failures are a special class of bug-one that has migrated into production and caused a serious problem, hence the word "failure." A product failure can be measured in terms of cost, cost to the user, cost to fix, or cost in lost revenues. Bugs detected and removed in test are much harder to quantify in this way.
The properties and criteria used to quantify tests and bugs are normally defined by an organization; so they are local and they vary from project to project. In Chapters 11 through 13, I introduce path and data analysis techniques that will help you standardize the test metric across any system or project.
Time
Units of time are used in several test metrics, for example, the time required to run a test and the time available for the best test effort. Let's look at each of these more closely.
The Time Required to Run a Test
This measurement is absolutely required to estimate how long a test effort will need in order to perform the tests planned. It is one of the fundamental metrics used in the test inventory and the sizing estimate for the test effort.
The time required to conduct test setup and cleanup activities must also be considered. Setup and cleanup activities can be estimated as part of the time required to run a test or as separate items. Theoretically, the sum of the time required to run all the planned tests is important in estimating the overall length of the test effort, but it must be tempered by the number of times a test will have to be attempted before it runs successfully and reliably.
-
Sample Units: Generally estimated in minutes or hours per test. Also important are the number of hours required to complete a suite of tests.
The Time Available for the Test Effort
This is usually the most firmly established and most published metric in the test effort. It is also usually the only measurement that is consistently decreasing.
-
Sample Units: Generally estimated in weeks and measured in minutes.
The Cost of Testing
The cost of testing usually includes the cost of the testers' salaries, the equipment, systems, software, and other tools. It may be quantified in terms of the cost to run a test or a test suite.
Calculating the cost of testing is straightforward if you keep good project metrics. However, it does not offer much cost justification unless you can contrast it to a converse-for example, the cost of not testing. Establishing the cost of not testing can be difficult or impossible. More on this later in the chapter.
-
Sample Units: Currency, such as dollars; can also be measured in units of time.
Tests
We do not have an invariant, precise, internationally accepted standard unit that measures the size of a test, but that should not stop us from benefiting from identifying and counting tests. There are many types of tests, and they all need to be counted if the test effort is going to be measured. Techniques for defining, estimating, and tracking the various types of test units are presented in the next several chapters.
Tests have attributes such as quantity, size, importance or priority, and type
Sample Units (listed simplest to most complex):
-
A keystroke or mouse action
-
An SQL query
-
A single transaction
-
A complete function path traversal through the system
-
A function-dependent data set
Bugs
Many people claim that finding bugs is the main purpose of testing. Even though they are fairly discrete events, bugs are often debated because there is no absolute standard in place for measuring them.
-
Sample Units: Severity, quantity, type, duration, distribution, and cost to find and fix. Note: Bug distribution and the cost to find and fix are derived metrics.
Like tests, bugs also have attributes as discussed in the following sections.
Severity
Severity is a fundamental measure of a bug or a failure. Many ranking schemes exist for defining severity. Because there is no set standard for establishing bug severity, the magnitude of the severity of a bug is often open to debate. Table 5.1 shows the definition of the severity metrics and the ranking criteria used in this book.
| SEVERITY RANKING | RANKING CRITERIA |
|---|---|
| Severity 1 Errors | Program ceases meaningful operation |
| Severity 2 Errors | Severe function error but application can continue |
| Severity 3 Errors | Unexpected result or inconsistent operation |
| Severity 4 Errors | Design or suggestion |
Bug Type Classification
First of all, bugs are bugs; the name is applied to a huge variety of "things." Types of bugs can range from a nuisance misunderstanding of the interface, to coding errors, to database errors, to systemic failures, and so on.
Like severity, bug classification, or bug types, are usually defined by a local set of rules. These are further modified by factors like reproducibility and fixability.
In a connected system, some types of bugs are system "failures," as opposed to, say, a coding error. For example, the following bugs are caused by missing or broken connections:
-
Network outages.
-
Communications failures.
-
In mobile computing, individual units that are constantly connecting and disconnecting.
-
Integration errors.
-
Missing or malfunctioning components.
-
Timing and synchronization errors.
These bugs are actually system failures. These types of failure can, and probably will, recur in production. Therefore, the tests that found them during the test effort test are very valuable in the production environment. This type of bug is important in the test effectiveness metric, discussed later in this chapter.
The Number of Bugs Found
For this metric, there are two main genres: (1) bugs found before the product ships or goes live and (2) bugs found after-or, alternately, those bugs found by testers and those bugs found by customers. As I have already said, this is a very weak measure until you bring it into perspective using other measures, such as the severity of the bugs found.
The Number of Product Failures
This measurement is usually established by the users of the product and reported through customer support. Since the customers report the failures, it is unusual for product failures that the customers find intolerable to be ignored or discounted. If it exists, this measurement is a key indicator of past performance and probable trouble spots in new releases. Ultimately, it is measured in money, lost profit, increased cost to develop and support, and so on.
This is an important metric in establishing an answer to the question "Was the test effort worth it?" But, unfortunately, in some organizations, it can be difficult for someone in the test group to get access to this information.
-
Sample Units: Quantity, severity, and currency.
The Number of Bugs Testers Find per Hour: The Bug Find Rate
This is a most useful derived metric both for measuring the cost of testing and for assessing the stability of the system. The bug find rate is closely related to the mean time between failures metric. It can give a good indication of the stability of the system being tested. But it is not helpful if considered by itself.
Consider Tables 5.2 and 5.3. The following statistics are taken from a case study of a shrink-wrap RAD project. These statistics are taken from a five-week test effort conducted by consultants on new code. These statistics are a good example of a constructive way to combine bug data, like the bug fix rate and the cost of finding bugs, to create information.
| Bugs found/hour | 5.33 bugs found/hr |
| Cost/bug to find | $9.38/bug to find |
| Bugs reported/hr | 3.25 bugs/hr |
| Cost to report | $15.38/bug to report |
| Cost/bug find and report | $24.76/bug to find and report |
| Bugs found/hour | 0.25 bugs found/hr |
| Cost/bug to find | $199.79 bug to find |
| Bugs reported/hr | 0.143 bugs/hr |
| Cost to report | $15.38/bug to report |
| Cost/bug find and report | $215.17 bug to find and report |
Notice that the cost of reporting and tracking bugs is normally higher than the cost of finding bugs in the early part of the test effort. This situation changes as the bug find rate drops, while the cost to report a bug remains fairly static throughout the test effort.
By week 4, the number of bugs being found per hour has dropped significantly. It should drop as the end of the test effort is approached. However, the cost to find each successive bug rises, since testers must look longer to find a bug, but they are still paid by the hour.
These tables are helpful in explaining the cost of testing and in evaluating the readiness of the system for production.
Bug Density per Unit: Where Are the Bugs Being Found?
Figure 5.1 shows the bug concentrations in four modules of a system during the system test phase. A graph of this type is one of the simplest and most efficient tools for determining where to concentrate development and test resources in a project.
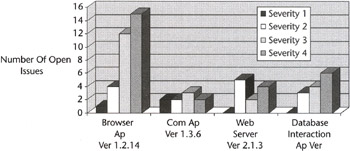
Figure 5.1: Bug density per unit.
Bug densities should be monitored throughout the test effort. The graph presented here was used successfully to allocate test and development resources toward the end of the test effort so that the product could be released on time. It shows both the number of bugs and the severity of those bugs in the four modules. Near the end of this test effort, extra programmers were assigned both to the Com Ap, because of the number of serious bugs it had open, and the Browser Ap, because of the large number of issues it had open.
Even though this type of chart is one of the most useful tools testers have for measuring code worthiness, it is one of the most seldom published. There is a common fear that these metrics will be used against someone. Care should be taken that these metrics are not misused. The highest bug density usually resides in the newest modules, or the most experimental modules. High bug densities do not necessarily mean that someone is doing a poor job. The important point is that there are bugs that need to be removed.
Bug Composition: How Many of the Bugs Are Serious?
As we have just discussed, there are various classes of bugs. Some of them can be eradicated, and some of them cannot. The most troublesome bugs are the ones that cannot be easily reproduced and recur at random intervals. Software failures and bugs are measured by quantity and by relative severity. Severity is usually determined by a local set of criteria, similar to the one presented in the preceding text.
If a significant percentage of the bugs being found in testing are serious, then there is a definite risk that the users will also find serious bugs in the shipped product. The following statistics are taken from a case study of a shrink-wrap RAD project. Table 5.4 shows separate categories for the bugs found and bugs reported.
| ERROR RANKING | RANKING DESCRIPTION: | BUGS FOUND | BUGS REPORTED |
|---|---|---|---|
| Severity 1 Errors | GPF or program ceases meaningful operation | 18 | 9 |
| Severity 2 Errors | Severe function error but application can continue | 11 | 11 |
| Severity 3 Errors | Unexpected result or inconsistent operation | 19 | 19 |
| Severity 4 | Design or suggestion | 0 | 0 |
| Totals | 48 | 39 |
Management required that only bugs that could be reproduced were reported. This is a practice that I discourage because it allows management and development to ignore the really hard bugs-the unreproducible ones. These bugs are then shipped to the users. Notice that half the Severity 1 bugs found were not reported. Inevitably, it will fall on the support group to try and isolate these problems when the users begin to report them.
Figure 5.2 shows the graphical representation of the bugs found shown in Table 5.4
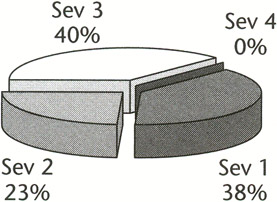
Figure 5.2: Bug distribution by severity.
The Severity 1 bugs reported represent 38 percent of all bugs found. That means that over a third of all the bugs in the product are serious. Simply put, the probability is that one of every three bugs the user finds in the shipped product will be serious. In this case, it is even worse than that because even if all of the serious bugs that were reported are fixed, it is probable that at least nine (unreported) hard-to-reproduce Severity 1 errors still exist in the product.
The Bug Fix Rate: How Many of the Bugs That Were Found Were Fixed?
![]()
There is a pervasive myth in the industry that all of the bugs found during testing are fixed before the product is shipped. Statistics gathered between 1993 and 1994 indicate that for commercial software, the actual bug fix rate is between 50 percent and 70 percent. Studies conducted in 1998 and 2000 showed bug fix rates of 80 percent to 85 percent in several commercial applications. Figure 5.3 shows the cumulative errors found and errors fixed curves in the 1998 study. The gap between the two curves at the end of the scale is the bugs that were not fixed.
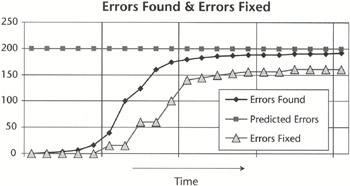
Figure 5.3: Bug fix rate from 1998 study.
Many of the shipped bugs are classified as "hard to reproduce." A study of production problems showed that two-thirds of the problems that occurred in production had been detected during the system test. However, because the test effort had not been able to reproduce these problems or isolate the underlying errors, the bugs had migrated into production with the system.
The risk of not shipping on time is better understood than the risk of shipping bugs that cannot be easily reproduced or are not well understood. If a test effort finds 98 percent of all the bugs ever found in the system but only fixes 50 percent of them, will it be a failure? If there is no estimation of the risk of shipping these bugs, management does not have enough information to make a well-informed decision. The pressure to ship on time becomes the overriding factor.
Metrics to Measure the Test Effort
The next metrics help measure the test effort itself, answering questions about how much was tested, what was achieved, and how productive the effort was.
Test Coverage: How Much of It Was Tested?
Given a set of things that could be tested, test coverage is the portion that was actually tested. Test coverage is generally presented as a percentage.
![]()
For example, 100 percent statement coverage means that all of the statements in a program were tested. At the unit test level, test coverage is commonly used to measure statement and branch coverage. This is an absolute measure; it is based on known countable quantities.
It is important to note that just because every statement in a group of programs that comprise a system was tested, this does not mean that the system was tested 100 percent. Test coverage can be an absolute measure at the unit level, but it quickly becomes a relative measure at the system level. Relative because while there are a finite number of statement tests and branch tests in a program, the number of tests that exist for a system is an unbounded set-for all practical purposes, an infinite set. Just as testing can never find all the bugs in a system, neither can testers find all the tests that could be performed on a system.
For test coverage to be a useful measurement at the system level, a list of tests must be constructed that serves as the basis for counting the total number of tests identified for a system. We will call this list the test inventory. (The test inventory is defined and discussed in the next chapter.) System test coverage is then a measure of how many of the known tests in a system were exercised.
![]()
The value of this test coverage metric depends on the quality and completeness of the test inventory. A test coverage of 100 percent of a system is only possible if the test inventory is very limited. Tom Gilb calls this "painting the bull's-eye around the arrow."
Test Effectiveness: How Good Were the Tests?
Test effectiveness is a measure of the bug-finding ability of the test set. If a comprehensive test inventory is constructed, it will probably be too large to exercise completely. This will be demonstrated as we proceed through the next several chapters. The goal is to pick the smallest test set from the test inventory that will find the most bugs while staying within the time frame. In a test effort, adequate test coverage does not necessarily require that the test set achieve a high rate of test coverage with respect to the test inventory.
It is usually easier to devise a comprehensive test set than it is to find the time and resources to exercise it fully or to track resulting problems to their source. Therefore, the number of tests that could be performed is almost always greater than the number that actually can be performed given the time and resources available. For example, a test effort conducted with a limited test inventory may achieve 100 percent test coverage by the end of the test cycle. However, regression testing around new code and bug fixes is usually limited in its scope because of time and resource constraints.
We can answer the question, "How good were the tests?" in several ways. One of the most common is to answer the question in terms of the number of bugs found by the users, and the type of bugs they were.
The bug-finding effectiveness of the test set can be measured by taking the ratio of the number of bugs found by the test set to the total bugs found in the product.
![]()
An effective test suite will maximize the number of bugs found during the test effort. We also want this test suite to be the smallest test set from the inventory that will accomplish this goal. This approach yields the highest test effectiveness (most bugs found) and highest test efficiency (least effort, expense, or waste). For example, if the test coverage of a system test suite covers only 50 percent of the test inventory but it finds 98 percent of all the bugs ever found in the system, then it probably provided adequate test coverage. The point is, the tests in the suite were the right 50 percent of the inventory-the most important tests. These tests found most of the bugs that were important to the user community. The benefits of increasing the test coverage for this system would be minimal.
Test effectiveness only measures the percentage of bugs that the test effort found. Some bugs will be found by both the testers and the users. These are only counted once. The test effectiveness metric differs from the performance metric, which I will introduce in a moment, in that effectiveness only counts found bugs and is not concerned with whether or not these bugs are ever fixed. Since most managers expect the test effort to result in bugs being removed from the product, the performance metric is what they want to see because it is concerned with the percentage of bugs that were found and fixed.
Test effectiveness is valuable when you are evaluating the quality of the test set. I use it as one of the selection criteria when I am distilling a test set that is a candidate for becoming a part of a production diagnostic suite. All the tests that I run during a test effort are part of the most important tests suite. The subset of these most important tests that can discover a failure are valuable indeed.
To select this subset, I use test effectiveness in conjunction with a certain class of bugs that I call failures. Failures are bugs that can recur even after they appear to have been fixed. (See the examples listed under the section Bug Type Classification earlier in the chapter.)
This failure-finding subset of the most important tests can provide years of value in the production environment as a diagnostics suite, especially if these tests are automated tests. Over the years, test suites that my team developed to test various systems and software products have been incorporated into basis suites used in real-time system monitoring, disaster recovery validation and verification, and real-time problem identification.
When the test effort can identify this test set and instantiate it in the production environment, the testers are delivering a very good return on the test investment. Some of my diagnostics suites have run for years in production environments with few changes. Often these tests are still running long after the original coding of the application or system has been retired.
Metrics to Track Testing: Will It Be Ready on Time?
The following set of derived metrics are used to track the test effort and judge the readiness of the product. By themselves, these metrics are not always helpful. They are extremely valuable in answering questions such as, "Are we on schedule?" and "Have we tested enough?" when they are used in conjunction with S-curves.
-
The number of tests attempted by a given time
-
The number of tests that passed by a given time
-
The number of bugs that were found by a given time
-
The number of bugs that were fixed by a given time
-
The average time between failures
How Much Did It Cost to Test It?
When you use the Most Important Tests method, it is possible to show management how big it is and what a given level of test coverage will require in time and resources. From this basis, it is possible to calculate cost. These techniques are very useful in the test estimation phase. S-curves can help you stay on track during the testing phase, and performance metrics can help you determine the actual cost of testing and what you got for the effort.
Calculating the cost of the effort afterward is one of the simplest of all the metrics in this chapter, even though it may have several components. It is very useful in make a comparative case to get enough budget-next time.
Metrics to Measure Performance: Was It Worth It?
| Note | Today, you have to show management that it was worth it. |
Not only does the test effort have to provide proof of its performance, it also needs to show that it adds enough value to the product to justify its budget. The performance of the test effort can be most accurately measured at the end of the life of a release. This makes it difficult to justify an ongoing test effort. Constant measurement by testers is the key to demonstrating performance.
Performance is (1) the act of performing, for instance, execution, accomplishment, fulfillment, and so on; and (2) operation or functioning, usually with regard to effectiveness.
The goal of the test effort is to minimize the number of bugs that the users find in the product. We accomplish this goal by finding and removing bugs before the product is shipped to the users. The performance of the test effort is based on the ratio of the total bugs found and fixed during test to all the bugs ever found in the system.
![]()
The performance of the last test effort, including its test coverage, bug fix rate, and the number of serious bugs that occurred or required fixes in the shipped product, are all used to evaluate the adequacy of the test effort. The cost of the test effort and the cost of the bugs found in production are also considered.
We measure to formulate theories capable of prediction. Next, we measure the results to determine the correctness of the predictions and then adjust the predictions for the next time. To evaluate the accuracy of predictions about the requirements of an adequate test effort, we need to examine several metrics.
This information can be used to adjust test coverage and bug fix requirements on the next release. For example, two test efforts conducted on similarly sized client server applications had the performance statistics shown in Table 5.5. Management determined, based on the number of calls to customer support, that the test effort for Case 1 was more than adequate, while the test effort for Case 2 was found to be inadequate.
Table 5.5: Determining If the Test Effort Was Adequate
| TEST COVERAGE | AVG. CALLS TO CUSTOMER SERVICE PER LICENSE IN FIRST 90 DAYS | BUG FIX RATE | PERFORMANCE RATIO (6 MO. AFTER RELEASE) | SEVERITY 1 BUGS REPORTED IN PRODUCTION | SEVERITY 2 BUGS REPORTED IN PRODUCTION |
|---|---|---|---|---|---|
| CASE STUDY 1 | |||||
| 67% | 5 | 70% | 98% | 0 | 6 |
| CASE STUDY 2 | |||||
|---|---|---|---|---|---|
| 100% | 30 | 50% | 75% | 7 | 19 |
| Severity 1 = Most serious bugs Severity 2 = Serious bugs | |||||
One of the problems in Case Study 2 is that the test inventory was probably insufficient. When a poor test inventory is coupled with a low bug fix rate, the result will be a marked increase in the number of calls to customer support and a reportedly higher rate of customer dissatisfaction.
It is necessary to distinguish between the adequacy of the test effort as a whole and the adequacy of the test coverage, because many of the problems that occur in production environments actually occurred during the test cycle. In other words, the bugs were triggered by the test set, but the bugs were not fixed during the test effort and consequently were shipped with the product.
The challenge here is that traditional test efforts cannot remove bugs directly. I have already talked about the management tools "argument" and "persuasion." The current trend is toward find-and-fix.
The Cost of Not Testing: How Much Did Testing Save?
As I mentioned already, this metric is very useful as a point of comparison, but very difficult to establish. The preceding case studies are good examples of how to limp around this problem. I have had the opportunity to conduct a couple of forensic studies in recent years, and I am convinced that the cost of not testing is profound, but because a product failure is such a sensitive issue, I have never been in a position to safely publish any details. It is a common managerial foil to portray a complete debacle as an overwhelming success and move right along to the next project-such are the ways of politics. If you have been involved in a failed product, you have probably experienced this phenomenon firsthand.
You can compare the cost of fixing a bug found in testing to the cost of fixing a bug in the shipped product. I have had some luck in recent years showing that my test effort had a positive cost-benefit ratio using this technique, but it requires intimate knowledge of the customer support process and the ability to track costs in the support area and the development area.
Testing never finds and removes all the bugs in a product. Testing only reduces the number of bugs and the risk of serious errors in the shipped product. If you keep good records, over time you can predict the percentage of certain classes of bugs that the test effort will find and remove. These percentages are also helpful in estimating the cost of not testing.
Other Contributions of the Test Effort
The test effort contributes other valuable things besides the finding of bugs. Testing collateral can provide several valuable resources to production, customer service, and the customers themselves.
I already mentioned the diagnostics suites for production. Installation instructions are another normal product of the test effort; they may be applicable to operations in the case of a system or to the end users in the case of a software product. Since the testers are the first expert users of the system, they are an invaluable asset to customer support in researching, explaining, and resolving customer issues.
Finally, since testers are the first expert users of a product, their questions, working notes, and instructions usually form the foundation of the user guide and seed for frequently asked questions documentation. It is a sad waste when the documentation creation process does not take advantage of this resource.
[1]There are well-defined quantified metrics and metrics systems available today in software testing. Unfortunately, many of these metrics are not fundamental measures; they are complex and often obscure. Function points [Jones 1995] and McCabe's Complexity [McCabe 1989] are examples. It is not immediately apparent from these names how to use these metrics, what they measure, or what benefits they offer. Special knowledge is required. Acquiring this knowledge requires an expenditure of time and resources. It is probably unreasonable to expect that practitioners can transition directly from no metrics to complex metrics.
|
|
EAN: 2147483647
Pages: 132