Section 7.3. Debugging
Tracing provides you with a snapshot of the steps your code has taken after the code has run. At times, however, you'd like to monitor your code while it is running. What you want is more of a CAT scan than an autopsy. The code equivalent of a CAT scan is a symbolic debugger.
When you run your code in the debugger, you can watch your code work, step by step. As you walk through the code, you can see the variables change values, and you can watch as objects are created and destroyed .
This section will provide a brief introduction to the most important parts of the debugger that accompanies the VS2005 IDE. For complete coverage of how to use the debugger, we urge you to spend time with the documentation and to experiment freely . The debugger is one of the most powerful tools at your disposal for learning ASP.NET.
An application can be configured to either enable or disable debugging. This is done through the configuration file, web.config , which is described more fully in Chapter 18. The debugging configuration information is contained within the <compilation> section, within the <system.web> section, which in turn is contained within the <configuration> section. So, a typical compilation configuration snippet will look something like Example 7-5.
Example 7-5. Debug configuration code snippet from web.config
<?xml version="1.0" encoding="utf-8" ?> <configuration xmlns="http://schemas.microsoft.com/.NetConfiguration/v2.0" > <system.web> . . . <compilation debug="true" />
Setting debug to false improves the runtime performance of the application.
7.3.1. The Debug Toolbar
A Debug toolbar is available in the IDE. To make it visible, click on the View  Toolbars menu commands, then click on Debug, if it is not checked. Table 7-3 shows the icons that appear on the Debug toolbar.
Table 7-3. Debug toolbar icons
| Icon | Debug menu equivalent | Keyboard shortcut | Description |
|---|---|---|---|
| | Toolbar handle. Click and drag to move the toolbar to a new location. | ||
| | Start / Continue | F5 | Starts or continues executing the program. |
| | Break All | Ctrl-Alt-Break | Stops program execution at the currently executing line. |
| | Stop Debugging | Shift-F5 | Stops debugging. |
| | Restart | Ctrl-Shift-F5 | Stops the run currently being debugged and immediately begins a new run. |
| | Shows next statement. | ||
| | Step Into | F11 | If the current line contains a call to a method or function, this icon will single-step the debugger into that method or function. |
| | Step Over | F10 | If the current line contains a call to a method or function, this icon will not step into that method or function but will go to the next line after the call. |
| | Step Out | Shift-F11 | If the current line is in a method or function, that method or function will complete and the debugger will stop on the line after the method or function call. |
| | Hexadecimal display toggle. | ||
| | Windows | Debug window selector. | |
| | Toolbar options. Offers options for adding and removing buttons from all toolbars (Debug, Text Editor, and so on). |
7.3.2. Breakpoints
"The crux of the biscuit is the apostrophe."
Frank Zappa, "Apostrophe(')"
Breakpoints are at the heart of debugging. A breakpoint is an instruction to .NET to run to a specific line in your code and to stop and wait for you to examine the current state of the application. As the execution is paused , you can do the following:
-
Examine and modify values of variables and expressions.
-
Single-step through the code.
-
Move into and out of methods and functions, even stepping into classes written in other CLR-compliant languages.
-
Perform any number of other debugging and analysis tasks .
7.3.2.1. Setting a breakpoint
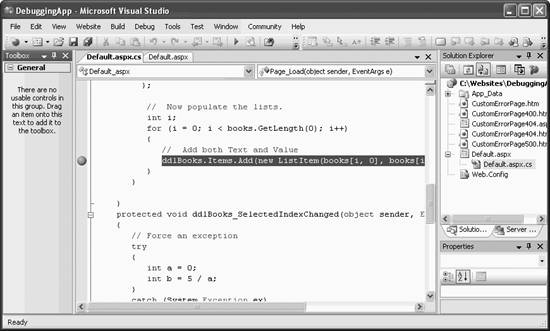
You can set a breakpoint in any window editing a .NET compliant language, such as C# or VB2005, by single-clicking on the gray vertical bar along the left margin of the window. A red dot will appear in the left margin and the line of code will be highlighted, as shown in Figure 7-6.
Figure 7-6. Setting a breakpoint
7.3.2.2. Breakpoint window
You can see all the breakpoints currently set by looking at the Breakpoint window . To display the Breakpoint window, perform any one of the following actions:
-
Press Ctrl-Alt-B.
-
Select Breakpoints from the Debug
Windows menu command. -
Click on the Windows icon of the Debug toolbar and select Breakpoints.
A Breakpoint window is shown in Figure 7-7.
Figure 7-7. Breakpoint window
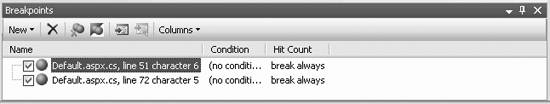
You can toggle a breakpoint between Enabled and Disabled by clicking on the corresponding checkbox in the Breakpoint window.
7.3.2.3. Breakpoint properties
Sometimes you don't want a breakpoint to stop execution every time the line is reached. VS2005 offers several properties that can be set to modify the behavior of a breakpoint. These properties can be set via the property menu, arrived at in either of two ways:
-
Right-click on the breakpoint glyph in the left margin.
-
Open the Breakpoint window and right-click on the desired breakpoint.
|

In either case, you will see the dialog box shown in Figure 7-8.
Figure 7-8. Breakpoint properties menu
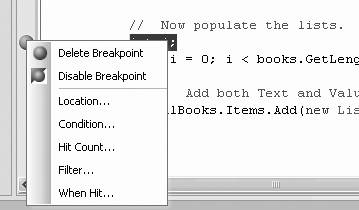
The first two items in the breakpoint properties menu allow you to delete or disable the selected breakpoint. The Disable menu item will toggle each time you click it, and when the breakpoint is disabled, the icon will appear as an empty circle.
The following menu items are available:
7.3.2.3.1. Location
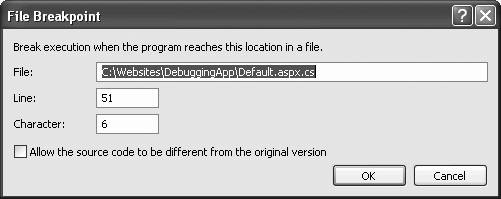
The Location menu item brings up the dialog box shown in Figure 7-9, which is fairly self-explanatory.
Figure 7-9. Breakpoint Location dialog box
7.3.2.3.2. Condition
The Condition button brings up the dialog shown in Figure 7-10.
Figure 7-10. Breakpoint Condition dialog box
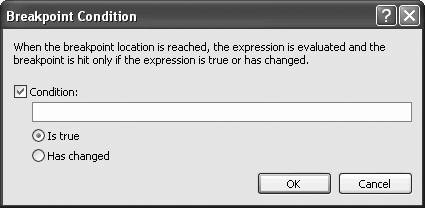
You can enter any valid expression in the edit field. This expression is evaluated when program execution reaches the breakpoint. Depending on which radio button is selected and how the Condition expression evaluates , the program execution will either pause or move on. The two radio buttons are labeled:
-
Is true
-
If the Condition entered evaluates to a Boolean true , then the program will pause.
-
Has changed
-
If the Condition entered has changed, then the program will pause. On the first pass through the piece of code being debugged, the breakpoint will never pause execution because there is nothing to compare against. On the second and subsequent passes , the expression will have been initialized and the comparison will take place.
7.3.2.3.3. Hit count
Hit count is the number of times that spot in the code has been executed since either the run began or the Reset Hit Count button was pressed. The Hit Count button brings up the dialog shown in Figure 7-11.
Figure 7-11. Breakpoint Hit Count dialog box
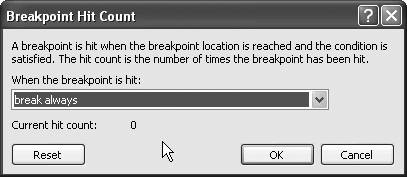
Clicking on the drop-down list presents the following options:
-
Break always
-
Break always when the hit count is equal to
-
Break always when the hit count is a multiple of
-
Break always when the hit count is greater than or equal to
If you click on any option other than "break always" (the default), the dialog box will add an edit field for you to enter a target hit count.
Suppose this is a breakpoint set in a loop of some sort . You select "break when the hit count is a multiple of" and enter 5 in the edit field. The program will pause execution every fifth time it runs.
When a hit count is set, the red breakpoint icon in the left margin of the window has a plus sign in the middle of it.
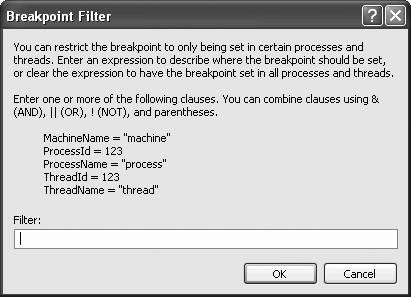
7.3.2.3.4. Filter
Setting a breakpoint filter allows you to specify machines, processes, or threads, or any combination thereof, for which a breakpoint will be in effect. The Filter menu item brings up the dialog box shown in Figure 7-12.
Figure 7-12. Breakpoint Filter dialog box
7.3.2.3.5. When Hit...
The When Hit menu item brings up the dialog box shown in Figure 7-13. By default, the Print a message checkbox is unchecked. When this box is checked, the red circular breakpoint icon in the left margin of the window changes to a diamond shape.
Figure 7-13. Breakpoint When Hit dialog box
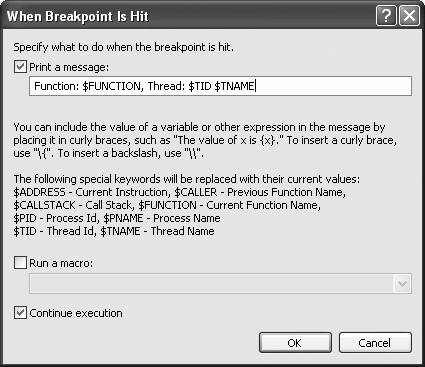
You can also elect to run one of a large selection of pre-defined macros, such as FindCase, SaveView and SaveBackup.
By default, the Continue execution checkbox is checked.
7.3.2.4. Breakpoint icons
Each breakpoint symbol, or glyph, conveys a different type of breakpoint. These glyphs appear in Table 7-4.
Table 7-4. Breakpoint icons
| Icon | Type | Description |
|---|---|---|
| | Enabled | A normal, active breakpoint. If breakpoint conditions or hit count settings are met, execution will pause at this line. |
| | Disabled | Execution will not pause at this line until the breakpoint is re-enabled. |
| | Error | The location or condition is not valid. |
| | Warning | The code at this line is not yet loaded, so a breakpoint can't be set. If the code is subsequently loaded, the breakpoint will become enabled. |
7.3.3. Stepping Through Code
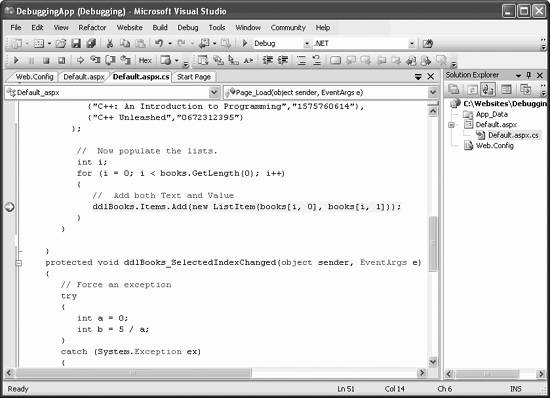
One of the most powerful techniques for debugging an application is to single-step through the code, giving you the opportunity to see the execution flow and to examine the value of variables, properties, objects, and so on. To see this in action, go to the code-behind file in the example. Place a breakpoint on the call to the Add method of the DropDownList control's Items collection, the line in the Page_Load method where the items are added to the DropDownList . Set the Hit Count to be a multiple of five (break always when hit count is a multiple of five). Then run the program.
The breakpoint will be hit, and the program will stop execution at the line of code containing the breakpoint, which will turn yellow. The breakpoint glyph in the left margin will have a yellow arrow on top of it. The VS2005 screen should look like Figure 7-14.
Figure 7-14. Breakpoint hit
You can now move forward a single statement or line at a time, stepping into any methods or functions as you go, by using one of the following techniques:
-
Select the Debug
Step Into menu command. -
Click on the Step Into icon (see Table 7-3 for a picture of the icon).
-
Press F11.
You can step through the code without going through called functions or methods. That is, you can step over the calls rather than into the calls, using one of the following techniques:
-
Select the Debug
Step Over menu item. -
Click on the Step Over icon (see Table 7-3 for a picture of the icon).
-
Press F10.
Finally, if you are debugging in a called method or function, you can step out of that method or function call, using one of the following techniques:
-
Select the Debug
Step Out menu command. -
Click on the Step Out icon (see Table 7-3 for a picture of the icon).
-
Press Shift-F11.
7.3.4. Examining Variables and Objects
Once the program is stopped , it is incredibly intuitive and easy to examine the value of objects and variables currently in scope. Place the mouse cursor over the top of any variable or object in the code, wait a moment, and a little pop-up window will appear with its current value.
If the cursor is hovering over a variable, the pop-up will contain the type of variable, its value (if relevant), and any other properties it may have.
If the cursor is hovering over some other object, the pop-up window will contain information relevant to its type, including its full namespace, syntax and a descriptive line of help.
7.3.5. Debug Windows
The debug windows are optimized to show program information in a specific way. The following sections will describe each of the windows.
All of the windows can be accessed in one of three ways: with a shortcut key combination, from the Debug Windows menu command, or from the Windows icon of the Debug toolbar. Table 7-5 summarizes all the windows, along with the shortcut keys for accessing each window.
Table 7-5. Accessing debug windows
| Window name | Shortcut keys | Description |
|---|---|---|
| Immediate | Ctrl-Alt-I | View any variable or expression. |
| Autos | Ctrl-Alt-V followed by A | View all variables in the current and previous statement. |
| Locals | Ctrl-Alt-V followed by L | View all variables in the current context. |
| Watch | Ctrl-Alt-W, followed by either 1, 2, 3, or 4 | View up to four different sets of variables of your choosing. |
| Call Stack | Ctrl-Alt-C | View all methods on the call stack. |
| Threads | Ctrl-Alt-H | View and control threads. |
| Modules | Ctrl-Alt-U | View all modules in use. |
| Disassembly | Ctrl-Alt-D | View current program in assembly code. |
| Registers | Ctrl-Alt-G | View microprocessor registers. |
| Memory | Ctrl-Alt-M followed by n, where n is either 1, 2, 3, or 4 | View contents of up to four different memory addresses. |
7.3.5.1. Immediate window
The Immediate window allows you to type almost any variable, property, or expression and immediately see its value.
You can enter expressions for immediate execution in the Immediate window. If you want to see the value of an expression, prepend it with a question mark. For instance, if the breakpoint is on the line shown in Figure 7-14, you will see the value of the integer i by entering either of the following lines (they are equivalent):
?i i
in the Immediate window and press Enter. Figure 7-15 shows the result of that exercise; additionally, this figure shows the process of assigning a new value to the variable i and then viewing its value again. If you change the value of a variable in the Immediate window and then continue to run the program, the new value will now be in effect.
Figure 7-15. Immediate window
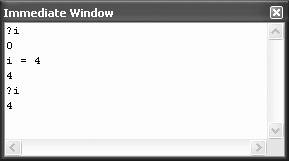
You can clear the contents of the Immediate window by right-clicking anywhere in the window and selecting Clear All. Close the window by clicking on the X in the upper-right corner. If you close the window and subsequently bring it back up in the same session, it will still have all the previous contents.
7.3.5.2. Autos window
The Autos window shows all the variables used in the current statement and the previous statement displayed in a hierarchical table.
A typical Autos window is shown in Figure 7-16.
Figure 7-16. Autos window
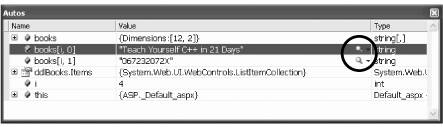
There are columns for the name of the object, its value, and its type. A plus sign next to an object indicates that it has child objects that are not displayed while a minus sign indicates that its child objects are visible. Clicking on a plus symbol expands out the tree and shows any children, while clicking on a minus symbol contracts the tree and displays only the parent. Values that change in the current step display in red.
You can select and edit the value of any variable. The value will display as red in the Autos window. Any changes to values take effect immediately.
7.3.5.3. Locals window
The Locals window is the same as the Autos window, except that it shows variables local to the current context. The current context is the method or function containing the current execution location.
7.3.5.4. Watch window
The Watch window is the same as the Autos window, except that it shows only variables, properties, or expressions you enter into the Name field in the window or drag from another window. The advantage of using a Watch window is that it allows you to watch objects from several different source windows simultaneously . This overcomes the inability to add object types other than the specified type to any of the other debug windows.
In addition to typing in the name of the object you want to watch, you can also drag and drop variables, properties, or expressions from a code window. Select the object in the code you want to put in the Watch window and then drag it to the Name field in the open Watch window.
You can also drag and drop objects from any of the following windows into the Watch window:
-
Locals
-
Autos
-
This
-
Disassembly
To drag something from one of these windows to the Watch window, both the source window and the Watch window must be open. Highlight a line in the source window and drag it down over the Watch tab. The Watch window will come to the foreground. Continue dragging the object to an empty line in the Watch window.
7.3.5.5. Call Stack window
The Call Stack window displays the names of the methods on the call stack and their parameter types and values. You can control which information is displayed in the Call Stack window by right-clicking anywhere in the window and toggling field names that appear in the lower portion of the pop-up menu.
7.3.5.6. Threads window
The Threads window allows you to examine and control threads in the program you are debugging. Threads are sequences of executable instructions. Programs can be single-threaded or multithreaded. The whole topic of threading and multiprocess programming is beyond the scope of this book.
7.3.5.7. Modules window
The Modules window allows you to examine the .exe and .dll files being used by the program being debugged.
A Modules window is shown in Figure 7-17.
Figure 7-17. Modules window
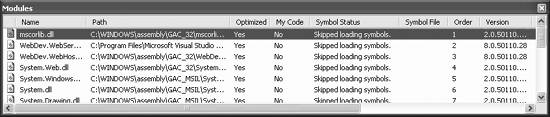
By default, the modules are shown in the order in which they were loaded. You can re-sort the table by clicking on any of the column headers.
7.3.5.8. Disassembly window
The Disassembly window shows the current program in assembly code. If you are debugging managed code, such as that which comes from VB2005, C#, or Managed C++, this will correspond to Microsoft Intermediate Language (MSIL) code.
A Disassembly window is shown in Figure 7-18.
Figure 7-18. Disassembly window
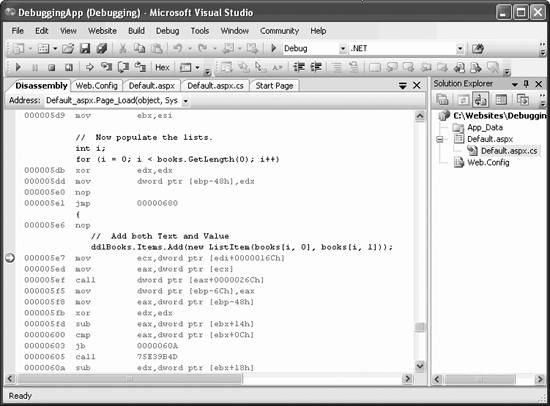
Unlike the previous windows discussed in this chapter, the Disassembly window displays as a tabbed item as part of the main work surface. You can set breakpoints anywhere in the window, just as for any other Source code window.
7.3.5.9. Registers window
The Registers window allows you to examine the contents of the microprocessor's registers. Values that have changed recently are displayed in red.
You can select which pieces of information to view by right-clicking anywhere in the Registers window and clicking on the information you would like displayed.
7.3.5.10. Memory windows
There are four Memory windows available for viewing memory dumps of large buffers, strings, and other data that will not display well in any other window. These four memory windows are for watching four different memory addresses.
EAN: 2147483647
Pages: 173