Debugging
Debugging
It is a painful thing
To look at your own trouble and know
That you yourself and no one else has made it
Sophocles, Ajax
The word bug has been used to describe an "object of terror" ever since the fourteenth century. Rear Admiral Dr. Grace Hopper, the inventor of COBOL, is credited with observing the first computer bug ” literally, a moth caught in a relay in an early computer system. When asked to explain why the machine wasn't behaving as intended, a technician reported that there was "a bug in the system," and dutifully taped it ”wings and all ”into the log book.
Regrettably, we still have " bugs " in the system, albeit not the flying kind. But the fourteenth century meaning ”a bogeyman ”is perhaps even more applicable now than it was then. Software defects manifest themselves in a variety of ways, from misunderstood requirements to coding errors. Unfortunately, modern computer systems are still limited to doing what you tell them to do, not necessarily what you want them to do.
No one writes perfect software, so it's a given that debugging will take up a major portion of your day. Let's look at some of the issues involved in debugging and some general strategies for finding elusive bugs.
Psychology of Debugging
Debugging itself is a sensitive, emotional subject for many developers. Instead of attacking it as a puzzle to be solved , you may encounter denial, finger pointing, lame excuses, or just plain apathy.
Embrace the fact that debugging is just problem solving, and attack it as such.
Having found someone else's bug, you can spend time and energy laying blame on the filthy culprit who created it. In some workplaces this is part of the culture, and may be cathartic. However, in the technical arena, you want to concentrate on fixing the problem, not the blame.
Tip 24
Fix the Problem, Not the Blame
It doesn't really matter whether the bug is your fault or someone else's. It is still your problem.
A Debugging Mindset
The easiest person to deceive is one's self
Edward Bulwer-Lytton, The Disowned
Before you start debugging, it's important to adopt the right mindset. You need to turn off many of the defenses you use each day to protect your ego, tune out any project pressures you may be under, and get yourself comfortable. Above all, remember the first rule of debugging:
Tip 25
Don't Panic
It's easy to get into a panic, especially if you are facing a deadline, or have a nervous boss or client breathing down your neck while you are trying to find the cause of the bug. But it is very important to step back a pace, and actually think about what could be causing the symptoms that you believe indicate a bug.
If your first reaction on witnessing a bug or seeing a bug report is "that's impossible ," you are plainly wrong. Don't waste a single neuron on the train of thought that begins "but that can't happen" because quite clearly it can, and has.
Beware of myopia when debugging. Resist the urge to fix just the symptoms you see: it is more likely that the actual fault may be several steps removed from what you are observing, and may involve a number of other related things. Always try to discover the root cause of a problem, not just this particular appearance of it.
Where to Start
Before you start to look at the bug, make sure that you are working on code that compiled cleanly ”without warnings. We routinely set compiler warning levels as high as possible. It doesn't make sense to waste time trying to find a problem that the compiler could find for you! We need to concentrate on the harder problems at hand.
When trying to solve any problem, you need to gather all the relevant data. Unfortunately, bug reporting isn't an exact science. It's easy to be misled by coincidences, and you can't afford to waste time debugging coincidences. You first need to be accurate in your observations.
Accuracy in bug reports is further diminished when they come through a third party ”you may actually need to watch the user who reported the bug in action to get a sufficient level of detail.
Andy once worked on a large graphics application. Nearing release, the testers reported that the application crashed every time they painted a stroke with a particular brush. The programmer responsible argued that there was nothing wrong with it; he had tried painting with it, and it worked just fine. This dialog went back and forth for several days, with tempers rapidly rising .
Finally, we got them together in the same room. The tester selected the brush tool and painted a stroke from the upper right corner to the lower left corner. The application exploded. "Oh," said the programmer, in a small voice, who then sheepishly admitted that he had made test strokes only from the lower left to the upper right, which did not expose the bug.
There are two points to this story:
-
You may need to interview the user who reported the bug in order to gather more data than you were initially given.
-
Artificial tests (such as the programmer's single brush stroke from bottom to top) don't exercise enough of an application. You must brutally test both boundary conditions and realistic end-user usage patterns. You need to do this systematically (see Ruthless Testing).
Debugging Strategies
Once you think you know what is going on, it's time to find out what the program thinks is going on.
Bug ReproductionNo, our bugs aren't really multiplying (although some of them are probably old enough to do it legally). We're talking about a different kind of reproduction. The best way to start fixing a bug is to make it reproducible. After all, if you can't reproduce it, how will you know if it is ever fixed? But we want more than a bug that can be reproduced by following some long series of steps; we want a bug that can be reproduced with a single command. It's a lot harder to fix a bug if you have to go through 15 steps to get to the point where the bug shows up. Sometimes by forcing yourself to isolate the circumstances that display the bug, you'll even gain an insight on how to fix it. See Ubiquitos Automation, for other ideas along these lines. |
Visualize Your Data
Often, the easiest way to discern what a program is doing ”or what it is going to do ”is to get a good look at the data it is operating on. The simplest example of this is a straightforward "variable name = data value" approach, which may be implemented as printed text, or as fields in a GUI dialog box or list.
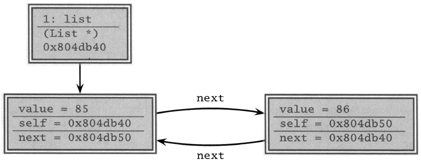
But you can gain a much deeper insight into your data by using a debugger that allows you to visualize your data and all of the interrelationships that exist. There are debuggers that can represent your data as a 3D fly-over through a virtual reality landscape, or as a 3D waveform plot, or just as simple structural diagrams, as shown in Figure 3.2 on the next page. As you single-step through your program, pictures like these can be worth much more than a thousand words, as the bug you've been hunting suddenly jumps out at you.
Figure 3.2. Sample debugger diagram of a circular linked list. The arrows represent pointers to nodes.
Even if your debugger has limited support for visualizing data, you can still do it yourself ”either by hand, with paper and pencil, or with external plotting programs.
The DDD debugger has some visualization capabilities, and is freely available (see [URL 19]). It is interesting to note that DDD works with multiple languages, including Ada, C, C++, Fortran, Java, Modula, Pascal, Perl, and Python (clearly an orthogonal design).
Tracing
Debuggers generally focus on the state of the program now. Sometimes you need more ”you need to watch the state of a program or a data structure over time. Seeing a stack trace can only tell you how you got here directly. It can't tell you what you were doing prior to this call chain, especially in event-based systems.
Tracing statements are those little diagnostic messages you print to the screen or to a file that say things such as "got here" and "value of x = 2." It's a primitive technique compared with IDE-style debuggers, but it is peculiarly effective at diagnosing several classes of errors that debuggers can't. Tracing is invaluable in any system where time itself is a factor: concurrent processes, real-time systems, and event-based applications.
You can use tracing statements to "drill down" into the code. That is, you can add tracing statements as you descend the call tree.
Trace messages should be in a regular, consistent format; you may want to parse them automatically. For instance, if you needed to track down a resource leak (such as unbalanced file opens/ closes ), you could trace each open and each close in a log file. By processing the log file with Perl, you could easily identify where the offending open was occurring.
Corrupt Variables? Check Their NeighborhoodSometimes you'll examine a variable, expecting to see a small integer value, and instead get something like 0x6e69614d. Before you roll up your sleeves for some serious debugging, have a quick look at the memory around this corrupted variable. Often it will give you a clue. In our case, examining the surrounding memory as characters shows us 20333231 6e69614d 2c745320 746f4e0a 1 2 3 M a i n S t , \n N o t 2c6e776f 2058580a 31323433 00000a33 o w n , \n x x 3 4 2 1 3\n20333231 6e69614d 2c745320 746f4e0a 1 2 3 M a i n S t , \n N o t 2c6e776f 2058580a 31323433 00000a33 o w n , \n x x 3 4 2 1 3\n\0\020333231 6e69614d 2c745320 746f4e0a 1 2 3 M a i n S t , \n N o t 2c6e776f 2058580a 31323433 00000a33 o w n , \n x x 3 4 2 1 3\n\0\0 Looks like someone sprayed a street address over our counter. Now we know where to look. |
Rubber Ducking
A very simple but particularly useful technique for finding the cause of a problem is simply to explain it to someone else. The other person should look over your shoulder at the screen, and nod his or her head constantly (like a rubber duck bobbing up and down in a bathtub). They do not need to say a word; the simple act of explaining, step by step, what the code is supposed to do often causes the problem to leap off the screen and announce itself. [7]
[7] Why "rubber ducking"? While an undergraduate at Imperial College in London, Dave did a lot of work with a research assistant named Greg Pugh, one of the best developers Dave has known. For several months Greg carried around a small yellow rubber duck, which he'd place on his terminal while coding. It was a while before Dave had the courage to ask....
It sounds simple, but in explaining the problem to another person you must explicitly state things that you may take for granted when going through the code yourself. By having to verbalize some of these assumptions, you may suddenly gain new insight into the problem.
Process of Elimination
In most projects, the code you are debugging may be a mixture of application code written by you and others on your project team, third-party products (database, connectivity, graphical libraries, specialized communications or algorithms, and so on) and the platform environment (operating system, system libraries, and compilers).
It is possible that a bug exists in the OS, the compiler, or a third-party product ”but this should not be your first thought. It is much more likely that the bug exists in the application code under development. It is generally more profitable to assume that the application code is incorrectly calling into a library than to assume that the library itself is broken. Even if the problem does lie with a third party, you'll still have to eliminate your code before submitting the bug report.
We worked on a project where a senior engineer was convinced that the select system call was broken on Solaris. No amount of persuasion or logic could change his mind (the fact that every other networking application on the box worked fine was irrelevant). He spent weeks writing work-arounds, which, for some odd reason, didn't seem to fix the problem. When finally forced to sit down and read the documentation on select, he discovered the problem and corrected it in a matter of minutes. We now use the phrase "select is broken" as a gentle reminder whenever one of us starts blaming the system for a fault that is likely to be our own.
Tip 26
"select" Isn't Broken
Remember, if you see hoof prints, think horses ”not zebras. The OS is probably not broken. And the database is probably just fine.
If you "changed only one thing" and the system stopped working, that one thing was likely to be responsible, directly or indirectly, no matter how farfetched it seems. Sometimes the thing that changed is outside of your control: new versions of the OS, compiler, database, or other third-party software can wreak havoc with previously correct code. New bugs might show up. Bugs for which you had a work-around get fixed, breaking the work-around . APIs change, functionality changes; in short, it's a whole new ball game, and you must retest the system under these new conditions. So keep a close eye on the schedule when considering an upgrade; you may want to wait until after the next release.
If, however, you have no obvious place to start looking, you can always rely on a good old-fashioned binary search. See if the symptoms are present at either of two far away spots in the code. Then look in the middle. If the problem is present, then the bug lies between the start and the middle point; otherwise , it is between the middle point and the end. You can continue in this fashion until you narrow down the spot sufficiently to identify the problem.
The Element of Surprise
When you find yourself surprised by a bug (perhaps even muttering "that's impossible" under your breath where we can't hear you), you must reevaluate truths you hold dear. In that linked list routine ”the one you knew was bulletproof and couldn't possibly be the cause of this bug ”did you test all the boundary conditions? That other piece of code you've been using for years ”it couldn't possibly still have a bug in it. Could it?
Of course it can. The amount of surprise you feel when something goes wrong is directly proportional to the amount of trust and faith you have in the code being run. That's why, when faced with a "surprising" failure, you must realize that one or more of your assumptions is wrong. Don't gloss over a routine or piece of code involved in the bug because you "know" it works. Prove it. Prove it in this context, with this data, with these boundary conditions.
Tip 27
Don't Assume It ”Prove It
When you come across a surprise bug, beyond merely fixing it, you need to determine why this failure wasn't caught earlier. Consider whether you need to amend the unit or other tests so that they would have caught it.
Also, if the bug is the result of bad data that was propagated through a couple of levels before causing the explosion, see if better parameter checking in those routines would have isolated it earlier (see the discussions on crashing early and assertions on pages 120 and 122, respectively).
While you're at it, are there any other places in the code that may be susceptible to this same bug? Now is the time to find and fix them. Make sure that whatever happened , you'll know if it happens again.
If it took a long time to fix this bug, ask yourself why. Is there anything you can do to make fixing this bug easier the next time around? Perhaps you could build in better testing hooks, or write a log file analyzer.
Finally, if the bug is the result of someone's wrong assumption, discuss the problem with the whole team: if one person misunderstands, then it's possible many people do.
Do all this, and hopefully you won't be surprised next time.
Debugging Checklist
-
Is the problem being reported a direct result of the underlying bug, or merely a symptom?
-
Is the bug really in the compiler? Is it in the OS? Or is it in your code?
-
If you explained this problem in detail to a coworker, what would you say?
-
If the suspect code passes its unit tests, are the tests complete enough? What happens if you run the unit test with this data?
-
Do the conditions that caused this bug exist anywhere else in the system?
Related sections include:
-
Assertive Programming
-
Programming by Coincidence
-
Ubiquitous Automation
-
Ruthless Testing
Challenges
-
Debugging is challenge enough.
EAN: 2147483647
Pages: 81