Evaluating the Pros and Cons of Each Alternative
|
| < Day Day Up > |
|
Evaluating the Pros and Cons of Each Alternative
Occasionally, there is a single, clear-cut choice for where to put the intelligence. You are low on disk space, so you add it to the universe; the calculation is too complex for SQL, so you create a report variable. These are the easy answers. The not-so-easy answers are everything else in between. The best place for intelligence is the consultant’s annoying but valid answer, “it depends.” In the following sections, I give examples of business intelligence that are better suited to one place over another. Each alternative will have a cost associated. The question you must answer is whether the benefit outweighs the cost. Building intelligence into the fact table provides faster response time and consistent results; is this a strong enough benefit to justify the cost of redesigning the table, modifying the load routines, and buying more disk space? In some cases, absolutely. In other cases, no.
MOLAP Cubes
In presenting this topic at the BusinessObjects 2002 User Conference, I was disappointed (but not surprised) to see that only a small percentage of companies integrate MOLAP cubes with the BusinessObjects deployment.
MOLAP Cubes as Independent Applications
MOLAP cubes often are treated as separate applications for several reasons. First, each MOLAP vendor provides their own access tools:
-
Hyperion and IBM provide Analyzer and a spreadsheet to access Essbase or DB2 OLAP cubes.
-
Microsoft uses Excel to access MS Analysis Services cubes; Knosys’ Proclarity is a third-party front end that is quite powerful.
-
SAP/BW provides BW/Explorer as a front end to BW Info Cubes.
Just as data marts and BI implementations can be implemented departmentally, so can MOLAP databases. Unless a business sponsor and program management are in place to integrate the two, it seems rarely to happen. Vendors do little to help enterprises understand the integration possibilities. In a competitive sales situation, vendors will push customers to select one vendor and corresponding architecture. Faced with tight budgets and limited resources, customers too would also like to implement one BI tool. From a marketing perspective, Business Objects still lists Essbase as an alternative BI tool (that is, competitor), despite the company’s efforts to improve the integration and treat it simply as another data source. Lastly, the MOLAP cubes may not be integrated with BusinessObjects, because until recently, the MOLAP vendors’ access tools were generally better than BusinessObjects’ OLAP access.
When Business Objects acquired OLAP@Work in 2000, it acquired a powerful spreadsheet add-in as well as technology that changed the way BusinessObjects OLAP access worked. The spreadsheet add-in, rebranded as Business Query for Excel MD, works only against MS Analysis Services cubes but is superior to what Microsoft itself offers. With OLAP access via BusinessObjects, users drill within a plain data access grid. This is not particularly appealing if users are accustomed to drilling within a chart or formatted report, as most MOLAP vendors’ tools allow. Thus, users may have built large queries and analyzed, explored, and drilled within a standard BusinessObjects document (Figure 13-2). With the OLAP@Work acquisition, the work flow changed for MS Analysis and SAP/BW users; users no longer drill within a plain grid; they use the grid to build a query and then drill within the microcube. Essbase and DB2 users can still drill within the plain grid, but it’s not for analysis purposes; it’s mainly for filtering the data.
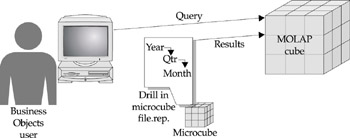
Figure 13-2: In a BusinessObjects full-client deployment, users drill within reports and not the MOLAP cube.
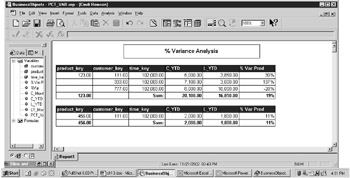
In Q1 2002, however, Business Objects released a new version of WebI that, for the first time, allowed formatted drilling, ranking, and sorting directly against a cube, similar to the way analysis tools from MOLAP vendors always worked (Figure 13-3). WebI now presents a formatted table or chart to a user. If the user double-clicks to drill down from Year to Quarter, this is done within the MOLAP cube, thus limiting network traffic and using the power of the MOLAP engine. The MOLAP server also performs sorts and nested rankings. At the same time, Business Objects also provided drill-through to details in WebI, by which users can be exploring a summary OLAP cube, then drill-through to details in a relational table (see Chapter 14, “Universal Drill-Through Service”).
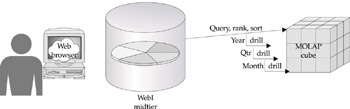
Figure 13-3: In a thin-client deployment, users drill against the MOLAP server via formatted reports and charts.
Despite these improvements, BusinessObjects MOLAP access is still disjointed, with different functionality in the different user tools and MOLAP databases. First, WebI three-tier mode does not support access to MOLAP cubes at all. Second, compare how the functionality varies for each of the MOLAP capabilities listed here:
| Functionality | Full Client | WebI Thin Client |
|---|---|---|
| Drill-in grid | Only for Essbase, DB2 OLAP, and Oracle Express; MS Analysis Services and SAP/BW use grid for query selection and not exploration | Yes |
| Drill-in formatted table or chart | Uses local report, not MOLAP server | Uses MOLAP server |
| Server-based sorts, rankings | Via Business Query MD only for MS Analysis Services | Yes |
| Write-access to cube for budgeting | Via Business Query MD only for MS Analysis Services | No |
Business Objects has a number of improvements planned for OLAP access in the second half of 2003. Some of the enhancements will address the functionality differences between the thin, 3-tier, and full-client MOLAP access.
Advantages of Building Intelligence in MOLAP Cubes
Clearly, for this section to have any relevance, your goal is to integrate your MOLAP cube as another data source in your BusinessObjects deployment. The question becomes, then, when to build intelligence into the MOLAP cube. As shown in Figure 13-1, when the intelligence is put in a MOLAP cube, the server does the work (place 1), thus minimizing network traffic. In general, building intelligence into any server-based technology will also ensure consistent business definitions (compared to varying calculations in user reports and spreadsheets). Further, MOLAP tools have a better understanding of business analysis than most SQL-based reporting tools, so a number of functions are built into the OLAP engine. For time period calculations, Essbase includes dynamic period-to-date calculations with a toggle (Figure 13-4). Period-to-date calculations are not as straightforward in MS Analysis Services, but many developers find MDX coding easier than the SQL CASE and DECODE functions presented in Chapter 10. Recall from Figure 8-2 and Figure 10-2 the issue with comparing inventories and account balances (one point in time) with material movements and debit/credits (a period of time). BusinessObjects handles this through multiple SQL statements and user training; however, MOLAP tools again are aware of these issues and allow you to flag with a simple setting how the measure is used. In Figure 13-4, note how inventory is flagged with TB First, telling Essbase to choose the first occurrence of a value within a corresponding time period; the aggregation is never over time, but rather, just one value for one period.
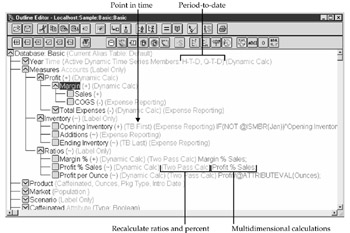
Figure 13-4: Hyperion Essbase handles much of the intelligence with simple toggles and no complex programming.
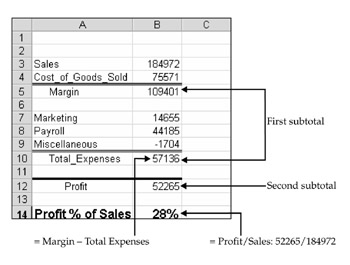
MOLAP cubes also provide you with more control over the calculation order, something particularly important for ratios and percentages. As an example of calculation order, look at the calculations for profit as a percent of sales, as shown in Figure 13-5. To get sales and profit totals for quarter four, you correctly sum across the rows. However, for profit as a percent of sales, if you sum across, you get an incorrect percentage of 84. To calculate percentages and ratios, you need first to get the sums by quarter, and then calculate down to take profit / sales. This second calculation gives you the correct result of 28 percent.
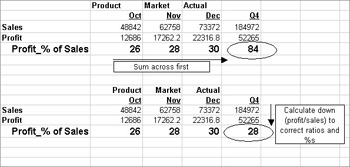
Figure 13-5: Percentages and ratios require a two-step calculation that MOLAP tools easily handle.
Similar to this concept of a two-pass calculation are multidimensional and forward-looking calculations. In Figure 13-4, profit and sales are at two different levels within the accounts hierarchy. To calculate profit, one must first know the subtotals for Margin and Total Expenses, as shown in the next screen (first subtotal). Profit is not a simple sum, but rather, an aggregation of Subtotal Margin – Subtotal Expenses (second subtotal). To calculate profit as a percentage of sales, you must know both levels of subtotals as well as the detail Sales that is used to calculate the Margin Subtotal; the database must look “forward” to first calculate Profit before it can calculate Sales as a percentage of Profit.
This is simple for MOLAP, which understands dimension members and levels (just say Profit % Sales!), but not so simple for SQL. Are there ways of doing this in the fact table, universe, or report? Of course! It’s all a matter of the time and cost to implement and maintain the intelligence.
With the exception of MS Analysis Services, which does not directly support alternate rollups, MOLAP is also an ideal place to store dimensional information that needs to be aggregated in different ways. As discussed early in this chapter, a customer dimension could have groupings by physical region or by type of customer (newly married). Users are viewing the same measures but by different groupings. MOLAP tools allow dimensions to be aggregated in different ways, often without drastically increasing the size of the database.
Disadvantages of MOLAP
Before you rush out to buy the latest version of a MOLAP tool, note that they do have their disadvantages. First, they are another database and another data source. If your organization is strapped for IT resources, you may be forced to limit which technologies you can support. As a separate database, it is another copy of the data. However, if the MOLAP tool is integrated correctly with your data warehouse, I would argue that it is in fact another, smarter way to provide aggregate tables. MOLAP tools are famous for ensuring consistent response times on precalculated data; however, this requires smaller data sets than what an RDBMS can handle. Some MOLAP tools allow you to store data in relational tables (ROLAP) to increase capacity, yet this will have a performance impact. Although MOLAP tools are ideal for alternate roll-ups, they are not well suited for list analysis, and support for attribute analysis varies greatly. For example, if you want a list of customers above a certain age or a list of products packaged a particular way, MOLAP tools generally do not support this. The data would need to be stored in a relational table so that BusinessObjects could generate a tabular report; with MOLAP tools, all the information is stored as an intersection of a particular measure. In this way, it’s possible to analyze measures by dimensions and attributes, but it may not be possible to generate lists of dimensions and their attributes.
The following table summarizes the key benefits and disadvantages to putting the intelligence in a MOLAP cube:
| MOLAP Benefits | MOLAP Disadvantages |
|---|---|
| Built in period-to-date and point-in-time calculations | Additional cost and expertise |
| Control over calculation order for ratios and percentages | Risk of duplicate, inconsistent data if not integrated with data warehouse |
| Multidimensional and forward-looking calculations | Expertise generally comes from IT |
| Aggregated, so fast, consistent response times | |
| Server-based, so consistent business definitions and minimal network traffic |
Relational Tables
Building the intelligence into relational tables provides many of the same benefits as MOLAP cubes:
-
Tables are preprocessed and so are generally faster than the dynamic SQL that a universe or user object would use.
-
Tables involve server-based processing, so only limited data is sent across the network.
-
Tables are server-based, so business definitions are consistent.
Again taking the example of Current Year To Date Sales, a DBA could build a fact table with the following structure:
| product_key | customer_key | time_key | C_Month | LY_Month | C_YTD | L_YTD |
|---|---|---|---|---|---|---|
| 123 | 111 | 102003 | 500 | 400 | 5000 | 3850 |
| 456 | 111 | 102003 | 200 | 180 | 2000 | 1800 |
| 123 | 333 | 102003 | 710 | 300 | 7100 | 3000 |
| 123 | 777 | 102003 | 900 | 1000 | 8000 | 10000 |
As the data is loaded into the fact table, each column represents a “bucket” of information with the time period intelligence built into each column. C_MONTH contains sales for just the current month; C_YTD contains sales for each month in the current year. If the month is October, it contains sales from January through October.
Many analytic applications that build data marts (including SAP BW’s Info Cubes) use this kind of structure. However, if your company designs and builds your own fact tables, the DBA must program this kind of intelligence into the load routines; unlike in MOLAP cubes, there is no simple toggle to achieve time period intelligence. A robust ETL tool may help with the process. For example, Informatica’s Warehouse includes a package on time dimensions that allows Power Center (their corresponding ETL tool) to build fact tables with these “buckets” of time period information. Power Center uses flags within the time dimension tables to do the year-to-date calculations. Even with an ETL tool, this kind of design requires more disk space and a stronger understanding of best practices in data warehouse designs. DBAs may not have the resources to implement this kind of design or the time (show me a DBA that is not overworked and overscheduled!).
Recall from the first section in this chapter that dimension groupings such as customer age, income, product size, and color are also forms of intelligence. Analyzing data by dimensions is the bread and butter of most businesses. Providing alternative groupings can help reveal previously hidden patterns. For example, let’s take a wine merchant. Users can analyze sales by type of wine and rating. Users also can see which customers buy the most wine. Now break that customer list down by corporate customers versus individual consumers, and the analysis will reveal which group of customers generates the most business. If the dimension table contained income information for each corporate customer, the wine merchant can better understand if large corporate customers are more profitable than small business owners. The same logic applies to product information: what are sales for soft drinks in plastic bottles versus aluminum cans? Unfortunately, this kind of dimensional information is often not captured, or when it is captured, it is stored in departmental databases and spreadsheets. As discussed in Chapter 9, it is possible to incorporate personal lists of values into a universe; however, I would advocate that more dimensional information could be stored in the relational tables. If companies use a star or snowflake schema in data marts, then a data mart can contain both a standard customer dimension and a customer dimension with business-specific groupings and hierarchies. BusinessObjects can handle multiple dimensions with alternate hierarchies in each. Further, dimensional information in relational tables allows users to create lists and easily do attribute analysis with the information, something not all MOLAP tools support.
When Not to Store Intelligence in Relational Tables
Relational tables are not a good place to physically store ratios and variances, as the ratio always needs to be recalculated with an aggregated numerator and an aggregated denominator. To follow on the earlier example, let’s say you want to calculate the percentage variance between the current year-to-date sales (C_YTD) and last year’s year-to-date sales (LY_YTD). For each row in the database, you can correctly store the variance.
| product_key | customer_key | time_key | C_YTD | L_YTD | % Variance |
|---|---|---|---|---|---|
| 123 | 111 | 102003 | 5000 | 3850 | 29.87% |
| 123 | 333 | 102003 | 7100 | 3000 | 136.67% |
| 123 | 777 | 102003 | 8000 | 10000 | –20.00% |
However, recall that BusinessObjects users will create reports that dynamically group information by dimensions. Thus a business user may ask for a variance analysis by product. In order to allow this, the universe designer includes the SQL SUM aggregate in the object definition. This incorrectly sums the individual variance rows, suggesting that sales are 146.54 percent higher than last year sales. This is wrong!
| product_key | customer_key | time_key | C_YTD | L_YTD | % Variance |
|---|---|---|---|---|---|
| 123 | 111 | 102003 | 5000 | 3850 | 29.87% |
| 123 | 333 | 102003 | 7100 | 3000 | 136.67% |
| 123 | 777 | 102003 | 8000 | 10000 | –20.00% |
| Subtotal for product 123: | 20100 | 16850 | 146.54% |
To arrive at a correct variance, you must get the subtotal for the C_YTD by product 123, and then the subtotal of L_YTD to arrive at a correct variance of sales being 19.29 percent higher than last year. MOLAP tools allow an administrator to control the calculation order; SQL tools do not. To guarantee correct results, the universe designer would ignore the variance column in the fact table and dynamically calculate the variance using a SQL statement in an object.
Summary
The following table summarizes when to store the intelligence in a fact table and when it poses disadvantages:
| Relational Table Benefits | Relational Table Disadvantages |
|---|---|
| Precalculated in the table, so fast, consistent response times | Requires complex programming logic in the load routines |
| Server-based, so consistent business definitions and minimal network traffic | Fixed table design may limit flexibility IT/DBA must implement Requires additional disk space Not suitable for ratios and percentages |
Universe
I confess I am biased: I prefer to put as much intelligence as possible in the universe. Of course there are exceptions, but let’s start with the arguments for the universe. Intelligence in the universe offers much more flexibility than either a MOLAP cube or a relational table. When you add or modify an object, there is no need to restructure and recalculate a cube; there is no need to modify load routines and rebuild a table. The universe does not require the additional disk space that either MOLAP or RDBMS tables require. Because the universe is centralized, it enforces consistent business definitions. Further, as shown in Figure 13-1, the processing is done on the server, thus minimizing the impact on the network or WebI servers that user report formulas can overload. The universe allows partial control of the calculation order, necessary for ratios and variance analysis, something relational tables cannot offer in an ad hoc reporting environment. In the preceding example, you cannot aggregate the variance stored in a relational table or you get incorrect results. Within the universe, one uses the following syntax to control the calculation order:
(sum(C_YTD)-sum(L_YTD)) /sum(L_YTD)
As users build queries that analyze the percent variance by different dimensions (product, time, geography), the variance for each row returned is always recalculated with the correct numerator and denominator. Problems may arise when users add breaks and subtotals within a report, but this can easily be corrected with report formulas.
Intelligence in the universe also does not necessarily require an overworked/understaffed IT department to implement. New intelligence can be added quickly, as is critical in a changing business environment. Responsiveness and flexibility are the two main reasons I am biased toward building intelligence in the universe. If the BI deployment cannot respond as quickly as the business requirements change, it will be less successful. Requirements change not simply because users “overlooked” something, but more often, because they discovered a new or better way to explore information. Did anyone want to link click stream analysis with brick and mortar store sales before 1997?
The majority of companies put control of the universe in the hands of IT. This can be for the good, as IT staff have the skills to understand relationships between tables, joins, and index issues. They also can write complex SQL.
| Note | Programmers and DBAs certified in SQL are not necessarily adept at SQL for business reporting; this is often a unique and hard-to-find skillset. |
However, unless the IT department has a close relationship with the business and an understanding of business reporting requirements, they may miss opportunities to add intelligence to the universe. Users do not know SQL and do not know what objects can be built with SQL; IT knows SQL but may not realize that the business would benefit from measures such as number of customers (COUNT function), number of late orders (COUNT and DAYS_BETWEEN functions), variance analysis ((SUM1–SUM2)/SUM2), and so on. Further, a recurring complaint about IT maintaining the universe is lack of flexibility. Users want something, and IT is either too busy to implement it or wants to keep the universe general.
This is when it makes sense to allow individual functions or business units to build and maintain their own universes. IT should still quality-assure these universes (see Chapter 15, “Quality Assurance Check List”), but it may be easier to teach a power user how to build a universe than to get IT resources to build the universe the way the business wants.
When a universe designer fails to build enough intelligence into the universe to satisfy the common business needs, end users are forced to create their own objects or to build the intelligence in the report. This approach may be fine for individual needs, but it can be a disaster for reports that are widely shared, as it can significantly increase maintenance costs and the risk of inconsistent business definitions.
Disadvantages of Intelligence in the Universe
Even though I prefer to build a robust universe, there are times when the universe is not the best place for the intelligence. Advanced objects will generally use complex SQL or BusinessObjects functions to create the objects. This can result in unpredictable query response times. Also, as the universe becomes more complex, there is a greater risk that certain objects do not work well together. For example, if a universe contains the two objects Sales and Current YTD Sales, will the user receive accurate information if the user places these objects in the same query? The first object, Sales, does not include any time- period constraints. The user therefore adds Month=10 and Year=2002 as conditions in the report. This makes the Current YTD Sales information wrong (it’s now one month of data versus year-to-date) as BusinessObjects appends the WHERE clause to the entire query. Hopefully, users will recognize query results that are blatantly wrong; it’s the not-so- obvious ones that pose a problem. In either case, a perfect universe would include only those objects that can be accurately combined together; a real-world universe accomplishes this most of the time and supplements it with good object descriptions and training!
| Universe Benefits | Universe Disadvantages |
|---|---|
| Designers (IT or power users) can implement, so it is flexible | Use of complex business SQL is a unique skill |
| Server-based, so consistent business definitions and minimal network traffic | Unpredictable response times, as SQL is processed at query run time |
| Ratios and variances are correct | Individual objects may not be correct when combined with other objects with conflicting definitions |
User Objects
Here is another bias: I prefer to avoid the use of user objects. User objects cannot be shared by other users. Rarely does only one person work with or view a report, so if the intelligence is lacking in the universe, either put it in the universe or put it in the report so that it can be shared.
The one problem that a user object solves and a report formula does not is that of too much data being sent across the network. If a user is using SQL for standard transformations (UPPER, TO_CHAR, and so on), then the same amount of traffic is sent across the network for a user-defined object versus a report formula. However, if a user builds an object to use CASE, DECODE, or RANK, then the database server processes the query, generating less network traffic than a report variable that gets processed locally on the client or WebI midtier. Similarly, if users want to limit the number of rows returned by a calculation, they can use only existing objects as a condition in a query. For example, if a user wants to run a report in which the order date is less than or equal to the order date minus 90 days, this can only be accomplished by a condition object the designer has built or a user object the user creates.
When users build objects with SQL functions, it may require a modification to the database.prm file (Chapter 10), increasing ownership costs. Another concern about both user objects and report formulas is that the business definition may no longer be consistent. One user’s definition of Current Month Sales may be based on the accounting month the invoice was sent; another may define it with the calendar month, and yet another, the date the product was shipped.
The following table summarizes the pros and cons of user objects:
| User Object Benefits | User Object Disadvantages |
|---|---|
| Users can implement, so flexible | Use of complex business SQL is a unique skill |
| Server-based processing minimizes network traffic | Unpredictable response times, as SQL is processed at query run time Objects cannot be shared with other users May require modification to the database.prm file to access certain SQL functions Not centrally maintained, so increases risk of inconsistent business definitions and higher costs |
User Reports
With robust calculations and formulas, BusinessObjects offers users the ability to overcome many limitations in SQL. Users are familiar with formulas from spreadsheets and are comfortable building some quite powerful ones within the BusinessObjects documents. In some cases, users may have no choice but to create a formula in a report for the following reasons:
-
It’s an individual reporting need.
-
The intelligence cannot be built with SQL.
-
It’s immediate and involves no politics.
If the report really is for individual use and the formula is not a common business one, then the intelligence does indeed belong in a report.
SQL Limitations
SQL does have limitations. MOLAP tool vendors often emphasize their solutions as a way to overcome a number of limitations of SQL (forward calculations, time period versus point in time, and so on). However, IBM and Oracle recently released a number of SQL extensions that make SQL more robust. Forward calculations such as rankings and percent market share are now possible with SQL.
But clearly, not everyone uses DB2 and Oracle, and not all intelligence can be solved with SQL; this is where many BI vendors have excelled. BusinessObjects in particular contains a number of formula functions that do not have a SQL equivalent. Variance Percentage, Percentile, and Euro conversions are just a few. Long before vendors added analytic functions to SQL, BusinessObjects offered a percent of sum calculation, as well as Rank and RunningSum functions. Recall the particular problems that variance and ratio calculations can cause; the calculation order is very important to get the correct answer. With report formulas, users control the calculation order either by specifically inserting a formula at each break level or with Calculation Context Operators (explained in detail in Chapter 18). To use the earlier example of the variance between C_YTD and L_YTD, look how the percent variance is correctly calculated, even for the break levels by product.
In some cases, it may be technically feasible to build the intelligence into an object, but the user needs it immediately. IT may maintain the universe and be unable to create a new object quickly enough; the user creates a report formula for time expediency. The user also may want to avoid the politics of having to get common buy-in for a universe modification.
Disadvantages of Intelligence in User Reports
Too many report formulas can be problematic over time. First, report variables are stored within a document and therefore are not centrally maintained. As formulas change, there is no way to track how many versions of the report have been shared and modified. Multiple versions of the formula will now exist. This problem becomes worse when the original formula creator changes jobs or leaves the company. There once was a statistic about 75 percent of spreadsheets containing errors. I wouldn’t be surprised if report formulas have an equally high number of errors, or at the very least, cause a number of misunderstandings. One of my clients spent hours each month reconciling differences between two inventory reports: they both accessed the same universe in the data warehouse, but each contained different formulas. We eventually standardized on one report that became published and centrally maintained in the repository.
Second, report formulas contain a significant amount of intelligence that could, and should, be leveraged across the company. If a company is to ensure business consistency and capture the power of user report variables, you must develop a process to review and maintain formulas. Figure 13-6 shows one possible process. A user creates a standard report that contains a number of formulas (step 1). A report reviewer, who may be a power user or a universe designer, reviews the report and looks for formulas that are common needs (step 2). When they fulfill common reporting requirements, the universe designer builds the intelligence into the universe (step 3A). If it is not a broad reporting requirement but only fulfills the needs of a few users, then the intelligence will remain as a report formula. The report reviewer quality-assures the formula and uploads the report to the repository (step 3B). Users may balk at this additional level of quality control, and the last thing a company wants to do is add barriers to sharing information. An alternative is to let users freely publish documents to the repository, but ensure a report reviewer and/or universe designer checks the reports periodically, after publishing.
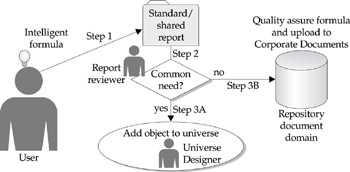
Figure 13-6: Creating a role of report reviewer can help companies minimize the risks of unnecessary and inconsistent report formulas.
Another major disadvantage of report variables is their effect on response time and system load. Overly complex reports can overload the WebI server. Formulas that require detail rows may cause too much data to be sent across the network. Let’s look at the example of Last Year YTD Sales.
The following report formula looks at the computer’s CurrentDate to determine which months are less than the current month. If it is less than the current month, then it displays the Amount Sold, else zero. The year must be one year ago.
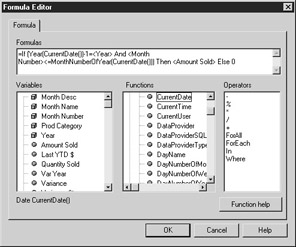
The report appears as follows (assuming the current date is October 31, 2000). Notice that while there were sales in November and December 1999, the rows for these months correctly display zeros.
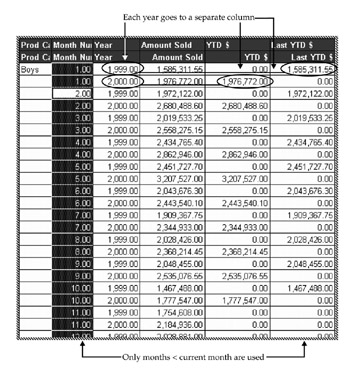
Notice also that for every month, you need a row of data to be sent to the client. If you are analyzing sales for 20,000 products, then this kind of report requires 240,000 input rows (12 months times 20,000 product). You do not need the individual rows displayed in your final report, but as shown in the preceding report, BusinessObjects needs the detail month rows to process the formula.
The next table summarizes the advantages and disadvantages of putting the intelligence in a user report.
| User Report Benefits | User Report Disadvantages |
|---|---|
| Users implement | Inconsistent business definitions |
| Flexible within an individual report | Increased maintenance costs, as reports and formulas are not centrally maintained |
| No politics to get defined centrally in the universe, RDBMS, or MOLAP cube | More rows than necessary shipped to client, slowing response time |
| Easy to build! |
I’ve presented different places in which to put the intelligence. As you can see, there is no clear-cut answer as to which place is best. I have said to end users, “What, are you crazy? That formula is much too complicated and important to be in a report!” I have also said to universe designers, “What, are you crazy? You can’t build that object in the universe!” It all depends on the benefits you are hoping to achieve (robustness, flexibility, consistent business definitions), your constraints (cost, skills, technology), as well as the trade-offs (time to implement, politics, maintenance effort, costs). Figure 13-7 is a traffic light table that compares the different places with the trade-offs for each alternative.
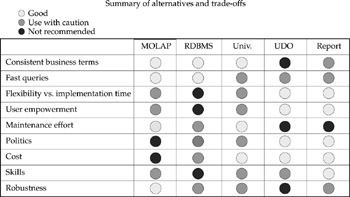
Figure 13-7: Deciding where to put the intelligence is a series of trade-offs.
If a box shows a “good” circle, then the place is good for that criterion in deciding where to put the intelligence; if it shows a “use with caution” circle, then proceed with caution and be aware of the risks; and if it shows a “not recommended” circle, there may be significant risks. For example, putting the intelligence in the RDBMS is great for consistency of business definitions (“good”) but is not very flexible (“not recommended”); however, when compared to a universe, the maintenance effort may be somewhat higher because of the effort to redo load programs and rebuild tables (“use with caution” versus “good”).
While it is important to consider these design principles in deploying BusinessObjects, it’s much more important that you add the intelligence somewhere!
|
| < Day Day Up > |
|
EAN: 2147483647
Pages: 206