OLAP Access
|
| < Day Day Up > |
|
In order to access MOLAP cubes such as Hyperion Essbase or Microsoft Analysis Services, you must have the corresponding OLAP Access Pack installed on your hard disk. You must also have access to the cube itself. Your BusinessObjects access rights do not flow through to MOLAP cubes, as they have their own security settings.
The query process is slightly different depending on which MOLAP server you are accessing. BusinessObjects acquired some of the OLAP access technology with its acquisition of OLAP@Work in 2000. With this acquisition, the OLAP Panel for MS Analysis Services and SAP/BW moved to acting solely as a selection screen, similar to the universe Query Panel; the OLAP Panel does not display any data values. However, with Hyperion Essbase and DB2 OLAP, the OLAP Panel still displays a grid of values. This grid makes it helpful to preview and drill around the data before running the query that returns the results to a BusinessObjects formatted report. Once you return the OLAP data to the BusinessObjects microcube, all the standard reporting and analysis features reviewed in earlier chapters are available to you. To better understand this workflow, refer to Figure 13-2.
Microsoft Analysis Services
The following example uses Microsoft Analysis Services as the OLAP data source. To access an MS Analysis Services data source:
-
Select File | New or click New to launch the New Report Wizard.
-
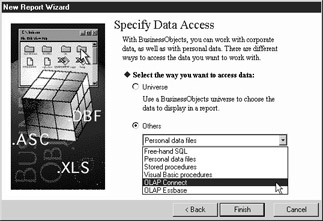
At the first Wizard screen, select Begin >. When the wizard prompts you to specify data access, select Others, then click the drop-down box to select an OLAP data source. For MS Analysis Services, select OLAP Connect.
-
If this is the first time you are accessing an MS Analysis Services cube from this computer, you must define an OLAP connection. If you are not prompted to define a connection, skip to step 5. You can connect to either a server-based cube or a local cube file that you exported from MS Analysis Services. To access the server-based cube, select the desired server name under Computer. Click Next >.
-
BusinessObjects displays the Customize Connection Information dialog box. Here you specify a connection name and an optional description. Enter a name and description, then click Finish.
-
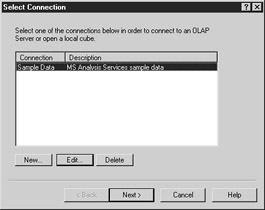
BusinessObjects displays the Select Connection dialog box. Once you have defined at least one connection to an MS Analysis Services cube from this PC, you will immediately be presented with this dialog box when you create a new document. From the Select Connection dialog, you can click New to define connections to other servers or local cubes. Select Next > to proceed with building a query.
-
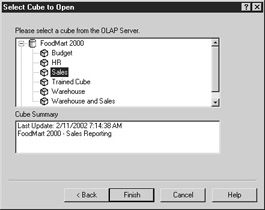
With MS Analysis Services, each server may have multiple databases. Each database may have multiple cubes. In the Select Cube to Open dialog box, click the + sign next to the database that contains the cube you wish to access. In the next example, Foodmart 2000 is a sample database that contains six cubes. Select the Sales cube and click Finish.
-
BusinessObjects displays the OLAP Panel shown in Figure 21-7. Specify your selection criteria and select OK to execute the query and display the results in a BusinessObjects report.
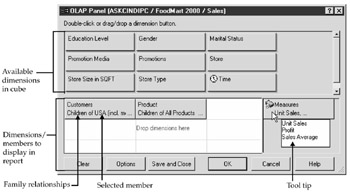
Figure 21-7: OLAP Panel for MS Analysis Services, Sales cube
The MS Analysis Services OLAP Panel
Within the OLAP Panel, the available cube dimensions are displayed in the top window. The bottom window is where you specify which dimensions and members you want to display in the report. To add a dimension to the report, drag it from the top window and place it in the grid. As you move across the dimensions in the grid, a tool tip appears to show which relationships or individual member values you have specified. For example, in Figure 21-7, the tool tip shows that the individual measure values Unit Sales, Profit, and Sales Average have been selected.
Dimension Properties
When you first drag a dimension to the grid, BusinessObjects automatically launches a Properties dialog box for the particular dimension. Figure 21-8 shows the Properties of Customers Dimension dialog box. By default, the actual member or data value information is displayed. Select the Levels tab to view the values by levels—for example, Country, State, City, and Individual Customer Name.
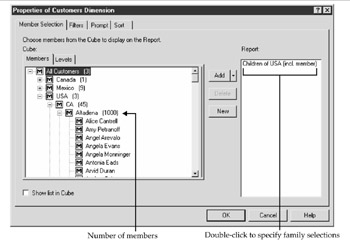
Figure 21-8: Properties of Customer Dimension
From the Properties Dimension dialog box, you can select the Filters tab to perform server-based ranking such as Top 10 Customers according to Sales Average or to select dimension values (Country, State, or Individual Customer) with a Sales Average above a certain value. You also can apply a filter according to a particular attribute of the Customer dimension. For example, to display sales for only male or female customers, add a Filter on the Gender attribute. Similar to the prompt operand for queries against BusinessObjects universes, the Prompt tab allows you to prompt users at run time to select a value from the customer dimension. The Sort tab allows you to sort dimension values alphabetically, hierarchically, or by a measure value. This sort option has the server perform the sort, but you can override the sort order in the local report via the Slice and Dice Panel.
If you want to see a particular dimension value or level in your report, select the value—for example, USA, and click Add. This adds the member name to the Report column, as shown in Figure 21-8.
Family Relationships
In MOLAP cubes, all the dimensional information is hierarchical. Within BusinessObjects classes, the hierarchies are optional. As the information is hierarchical, you can select specific member values such as USA, or you can select values in terms of a relationship. To specify additional selection options relative to USA, double-click USA to invoke the Family dialog box shown in Figure 21-9. Alternatively, you can right-click USA, then select Family.
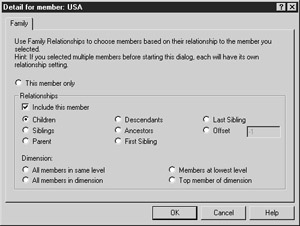
Figure 21-9: Family selections for a particular member
Figure 21-9 shows the Family selections for USA. Refer to the member values listed in Figure 21-8 to understand the relationships. By default, the family selection is the current value and the box This member only is checked. From the Family tab, you can select these additional relationships:
-
Include this member Becomes available when you select any other relationships. Once you select additional relationships, click this box to display USA in addition to the other relationships.
-
Children Displays the immediate children or next level in the dimension. The children of USA are the states.
-
Siblings Displays other countries on the same level as USA.
-
Parent Displays the grand total for All Customers.
-
Descendants Displays all the children, grandchildren, and so forth, for USA. In this example, all states, cities, and individual customers within USA would be displayed. Use caution when you select descendants, as some dimensions can contain thousands of members, making for a slow query and potentially returning too much data. For each dimension level, the Properties Dimension screen shows the number of members within each level.
-
Ancestors Selects all the grandparents and upper-level selections. If Alice Cantrell (the first customer in Figure 12-8) were selected, then the Ancestors are Altadena, CA, USA, and All Customers.
Caution Although there are additional sibling selections, the following do not work correctly in version 5.1.6.
-
First Sibling Selects the first value at the same level in the list—in this example, Canada.
-
Last Sibling Selects the last value at the same level.
-
Offset Allows you to enter a number to specify the position of the sibling. Negative numbers refer to members that appear before the selected value. Positive numbers appear after the selected value. In this example, an Offset of –1 would select Mexico, as it is one position before USA in the member list.
Hyperion Essbase
The following example uses Hyperion Essbase as the OLAP data source. To access an Essbase MOLAP cube:
-
Select File | New or click New to launch the New Report Wizard.
-
At the first New Report Wizard screen, select Begin >. When the wizard prompts you to specify data access, select Others, then click the drop-down box to select an OLAP data source. For Hyperion Essbase, select OLAP Essbase.
-
If this is the first time you are accessing Essbase from BusinessObjects from this computer, you are prompted to define an OLAP connection. Enter the name of the Essbase server, your Essbase username, and your password. Click Next >.
-
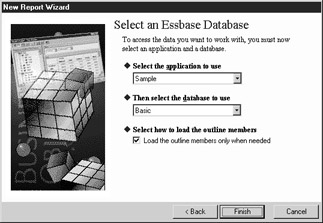
An Essbase server can have multiple applications and within an application, multiple databases. Use the drop-down menus to select the application and database. From this screen, you also have the option to load the outline members only when needed. Members in an Essbase outline correspond to the data values within a dimension column—for example, Customer Names or Product IDs. Therefore, the number of members within a dimension can be quite long. Leave this option set to expedite navigation within the OLAP Panel.
-
From within the New Report Wizard, click Finish. BusinessObjects displays the OLAP Panel shown in Figure 21-10.
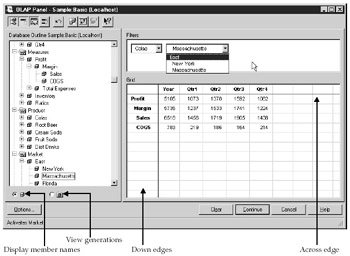
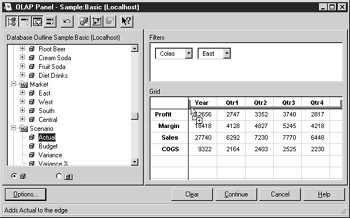
Figure 21-10: The Essbase OLAP Panel
The Essbase OLAP Panel
The OLAP Panel for Essbase is quite different than the OLAP Panel for MS Analysis Services shown in Figure 21-7. With the Essbase OLAP Panel, the dimensions and measures are displayed along the left side, similar to universe classes and objects. To expand a dimension, click the + next to the dimension folder. Some of the buttons within the OLAP Panel are similar to those in the standard Query Panel. The other big difference between the Microsoft OLAP Panel and the Essbase OLAP Panel is that the Essbase OLAP Panel displays the values whereas the Microsoft OLAP Panel displays the structure only. This allows you to do a limited amount of server-based analysis and drilling within the OLAP Panel before executing the query to generate a formatted report.
| Note | The object qualifications as dimension, measure, and detail are not correctly displayed in the OLAP Panel; everything is denoted as a dimension object. Once you select Continue and generate a BusinessObjects report, measures are accurately denoted with a sphere. For example, Profit is denoted with a blue dimension cube in the OLAP Panel, but with a pink measure sphere within a report. |
You build your initial query by dragging and dropping members from the outline to the grid. You can select an entire hierarchy or individual members. If you want to select an entire generation, view the hierarchies by generations by selecting the generations radio button in the bottom left of the OLAP Panel. To view the aliases (for example, that Product 100 is Colas) for the dimensions, select Options from the OLAP Panel. From the OLAP Panel Options dialog, select the General tab and under Aliases, check the box Use Table.
The Filters window of the panel enables you to define query conditions. Anything you add to the Filters window will later become section headers in a master/detail report. You can have multiple levels within the filters. For example, in Figure 21-10, the filter East will retrieve the totals for the Eastern region; the filters New York and Florida, which are children within East, will retrieve the data for these individual states. Once you begin analyzing the data offline in a report (rather than the server-based grid), you will still have the subtotal for East even though in the query you did not select all the states within East.
Items that you add to the Grid window become the column headings and rows of data. You can drill up and down within the grid. For example, the dimension member Margin has two children, Sales and COGS, displayed in the grid. To remove Sales and COGS from the grid:
-
Select Margin from within the grid, then right-click to invoke the following pop-up menu:
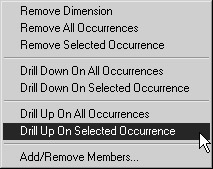
-
Select Drill Up on Selected Occurrence.
-
To drill down, double-click Margin.
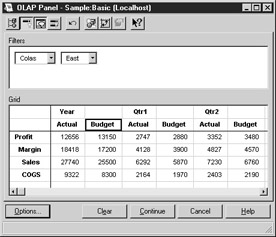
Within the Grid, you can insert multiple column levels, similar to stacking column headings within a crosstab report. For example, to analyze Actual versus Budget within a particular Year or Quarter, drag the member Actual to appear below Year. The status bar informs you that the action adds Actual to the edge. If your status bar is not displayed, click the Show/Hide Status Bar button. Ensure that you position your mouse below the Year column so that the drag-and-drop insertion shape corresponds to that in the following screen. If a full gray box appears, then you may be replacing a member rather than inserting an additional member to the grid.
Drag and drop the Budget to appear next to the Actual column. The final grid appears as follows:
To delete an object from the grid, you can either drag it away from the grid to the outline view or
-
Select the member in the grid.
-
Right-click to invoke the pop-up menu.
-
Select Remove Selected Occurrence.
Once you are satisfied with your filter and grid selections, click Continue from within the OLAP Panel to execute the query and return the results to the BusinessObjects document. You can then begin using the standard BusinessObjects reporting and analysis features.
The Add/Remove Panel
You can further refine the filter and grid selections through the Add/Remove Panel shown in Figure 21-11. You do not use this panel to select initial dimensions. It has three tabs:
-
Filters Allow you to specify the filters for existing dimensions in the filter window.
-
Down Edge Allows you to select individual members in the down edge of the grid.
-
Across Edge Allows you to select members in the across edge of the grid.
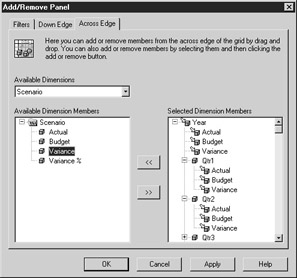
Figure 21-11: Refine filters with the Add/Remove Panel
Under Available Dimensions in Figure 21-11, Year and Scenario appear. These are currently the only dimensions displayed in the columns in the grid. In the earlier screen, you added the scenarios Actual and Budget to the grid through drag-and-drop. Now that Scenario exists in the grid, you can use the Add/Remove Panel to add the Variance member.
-
Launch the Add/Remove Panel by selecting the button from the toolbar. You also can right-click a dimension member within the grid and select Add/Remove Members from the pop-up menu.
-
Select the Across Edge tab.
-
From Available Dimensions, select the drop-down box, then Scenario.
-
From Available Dimension Members, expand the Scenario folder and select Variance. Click >> to add Variance to Selected Dimension Members.
-
Click Apply to close the dialog box and see the new member in the grid.
|
| < Day Day Up > |
|
EAN: 2147483647
Pages: 206