Conducting Interviews
Looking at How Information Is Presented
The second step in the analysis process involves reviewing the various ways in which the organization presents its data as information. During this process, you'll review items, such as hand-written documents, computer printouts, screen presentations, and Web pages.
Here are three of the most popular presentation methods that you'll encounter during this process:
-
Reports . A report is any document (hand-written, typed, or computer-generated) used to arrange and present data in such a way that it is meaningful to the person or people viewing it. Although using a software program (such as a word processor or spreadsheet) is the standard method of generating a report nowadays, you'll still find a number of reports written by hand or typed on a typewriter. (Yes, a typewriter!)
-
Screen presentations (a.k.a. slide shows). This type of presentation incorporates a series of screens that discuss various topics in an organized manner. It is generally created with a program, such as Microsoft PowerPoint or Lotus Freelance Graphics, and executed on a computer, but it can also be composed of a series of plastic sheets that are displayed on a screen by an overhead projector. (For our purposes, we'll assume that you're reviewing a computer-based screen presentation.)
-
Web pages. Many organizations are now making vast amounts of information available via Web pages on their Web sites. A Web page is used much in the same manner as a report, and, indeed, it is really nothing more than a different type of report.
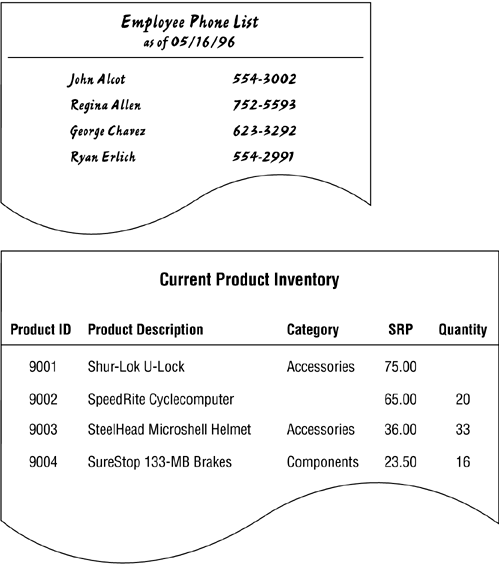
Begin this step by identifying and reviewing each report the organization generates from the database, regardless of whether they produce the report by hand or from within a software program. Gather samples of the reports and assemble them in a folder as you did with the items in the previous step. Overall, this task is easier to perform in this step than it was in the previous step because people in the organization are typically familiar with the reports they use. Copies of the reports are usually readily available, and most reports can be reprinted if necessary. Figure 6.4 shows an example of a report written by hand and a report generated from a word-processing program.
Figure 6.4. Examples of hand-written and computer-generated reports.
Next, review screen presentations that use or incorporate the data in the database. It's unnecessary for you to review every presentation, but you do need to review those that have a direct bearing on the data in the database. For example, you don't need to review a presentation on the organization's new product if it doesn't draw any data from the database. On the other hand, a presentation on sales statistics that does incorporate data from the database is one that you do need to review.
Once you've identified which presentations you need to review, go through each one carefully and make screen shots of the slides that use or incorporate data from the database. Copy the screen shots into a word-processing document, print the document, and then store the document in a folder for later use. (Write the name of the presentation and the date you captured the screen shots on the folder; you may need to refer to it again at a later time.) Follow this procedure separately for each presentation. You want to make sure you don't accidentally combine two or more presentations together, because this mistake will inevitably lead to mass confusion and result in one huge mess!
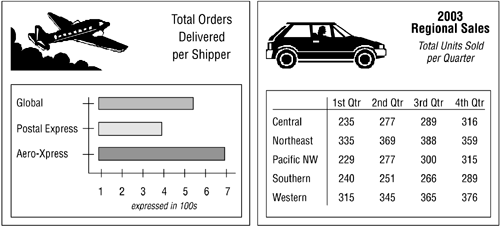
Figure 6.5 shows an example of the type of slides you'll examine during this review.
Figure 6.5. Examples of screen presentation slides.
Reviewing a presentation is difficult in some cases, and deciding whether or not a slide should be included as a sample is purely a discretionary decision. Therefore, work closely with the person most familiar with the presentation to ensure that you include all appropriate slides in the samples.
Finally, review Web pages that draw information directly from the database. Perform this review in the same manner as the review for the screen presentations. As with the previous review, you need to review those Web pages that have a direct bearing on the data in the database. For example, you don't need to review a Web page that provides a history of your organization, but you do need to review a Web page that displays regional employee information.
Once you've identified which Web pages you need to review, take a screen shot of each page. Copy the screen shots into a word-processing document, print the document, and then store the document in a folder for later use. (Write the uniform resource locator, or URL, address, and the current date under each screen shot in the document; you may need to refer to a particular Web page again at a later time.)
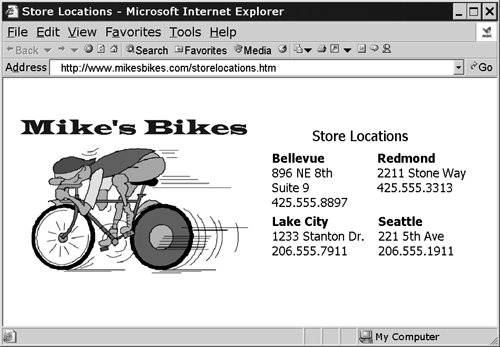
Figure 6.6 shows an example of a Web page you would examine during this review.
Figure 6.6. Example of a Web page that presents information from a database.
Whenever possible, work with the person (or persons) who created and developed the organization's Web site. She can save you a lot of time by directing you to the exact pages you should examine for this review.
| |
| Top |
EAN: 2147483647
Pages: 203