5.3 Traffic Measurements
5.3 Traffic Measurements
Telephone activity can be defined by the calling rate and the holding time, which is the duration of the call. The calling rate is the number of times a particular route or path is used per unit time period, while the holding time is the duration of the call on the route or path . Two other terms that warrant attention are the offered traffic and the carried traffic. The offered traffic is the volume of traffic routed to a particular telephone exchange during a predetermined time period, while the carried traffic is the volume of traffic actually transmitted through the exchange to its destination during a predetermined period of time.
5.3.1 The Busy Hour
The key factor required to dimension a traffic path is knowledge of the traffic intensity during the time period known as the busy hour (BH). Although traffic varies by day and time of day, and is generally random, it follows a certain consistency one can identify. In general, traffic peaks prior to lunch time and then rebuilds to a second daily peak in the afternoon. The busiest one-hour period of the day is known as the busy hour. It is the busy-hour traffic level that is employed in dimensioning telephone exchanges and transmission routes because one wants to size the exchange or route with respect to its busiest period.
It is important to note that the busy hour can vary considerably between organizations. For example, an Internet service provider (ISP) might experience its heaviest traffic between 7 and 8 p.m. once subscribers return home from work, digest their supper, and then attempt to go online. In comparison, a government agency would more than likely have its busy hour occur during the day.
Telephone traffic can be defined as the product of the calling rate per hour and the average holding time per call. This measurement can be expressed mathematically as:
where:
| C | = calling rate per hour |
| D | = average duration per call |
Using the above formula, traffic can be expressed in call-minutes (CM) or call-hours (CH), where a call-hour is the quantity represented by one or more calls having an aggregate duration of one hour.
If the calling rate during the busy hour of a particular day is 500 and the average duration of each call is 10 minutes, the traffic flow or intensity would be 500 * 10, or 5000 CM, which would be equivalent to 5000/60, or approximately 83.3 CH.
5.3.2 Erlangs and Call-Seconds
The preferred unit of measurement in telephone traffic analysis is the erlang, named after A.K. Erlang , a Danish mathematician . The erlang is a dimensionless unit in comparison to the previously discussed call-minutes and call-hours. It represents the occupancy of a circuit where one erlang of traffic intensity on one traffic circuit represents a continuous occupancy of that circuit.
A second term often used to represent traffic intensity is the call-second (CS). The quantity represented by 100 call-seconds is known as 1 CCS. Here, the first C represents the quantity 100 and comes from the French term " cent ." Assuming a one-hour unit interval, the previously discussed terms can be related to the erlang as follows:
If a group of 20 trunks is measured and a call intensity of 10 erlangs determined over the group , then we would expect one half of all trunks to be busy at the time of measurement. Similarly, a traffic intensity of 600 CM or 360 CCS offered to the 20 trunks would warrant the same conclusion. Table 5.2 is a traffic conversion table that will facilitate the conversion of erlangs to CCS and vice versa. Because the use of many dimensioning tables is based on traffic intensity in erlangs or CCS, the conversion of such terms frequently is required in the process of sizing facilities.
| Dimension | |||
|---|---|---|---|
| Minutes | Hours | Erlangs (intensity) Call-Hours (quantity) | CCS (quantity) |
| 12 | 0.2 | 0.2 | 6 |
| 24 | 0.4 | 0.4 | 12 |
| 36 | 0.6 | 0.6 | 18 |
| 48 | 0.8 | 0.8 | 24 |
| 60 | 1.0 | 1.0 | 36 |
| 120 | 2.0 | 2.0 | 72 |
| 180 | 3.0 | 3.0 | 108 |
| 240 | 4.0 | 4.0 | 144 |
| 300 | 5.0 | 5.0 | 180 |
| 360 | 6.0 | 6.0 | 210 |
| 420 | 7.0 | 7.0 | 252 |
| 480 | 8.0 | 8.0 | 288 |
| 540 | 9.0 | 9.0 | 324 |
| 600 | 10.0 | 10.0 | 360 |
| 900 | 15.0 | 15.0 | 540 |
| 1200 | 20.0 | 20.0 | 720 |
| 1500 | 25.0 | 25.0 | 900 |
| 1800 | 30.0 | 30.0 | 1080 |
| 2100 | 35.0 | 35.0 | 1260 |
| 2400 | 40.0 | 40.0 | 1440 |
| 2700 | 45.0 | 45.0 | 1620 |
| 3000 | 50.0 | 50.0 | 1800 |
| 6000 | 100.0 | 100.0 | 3600 |
To illustrate the applicability of traffic measurements to a typical communications network configuration, assume that your organization has a ten-position rotary connected to a LAN access controller. Further assume that you measured the number of calls and holding time per call during a one-hour period and determined the traffic distribution to be that illustrated in Figure 5.3. Note that the total holding time is 266 minutes (4.43 hours). Thus, the average traffic intensity during this one-hour period is 4.43/1, or 4.43 erlangs.
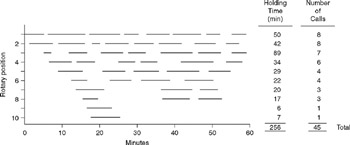
Figure 5.3: Traffic Distribution Example
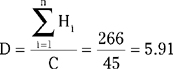
During the busy hour illustrated in Figure 5.3, a total of 45 calls resulted in a cumulative holding time of 266 minutes. Thus, the average holding time per call is 266/45, or 5.91 minutes, which is equivalent to 0.0985 hours. Multiplying the average holding time (0.0985 hours) per call by the number of calls (45) results in an average traffic intensity of 4.43 erlangs. Note that this tells us that if we know the average holding time and the number of calls, we can easily determine the traffic intensity. The previously noted relationship between the average traffic intensity (E) and the holding times on each rotary position (H i ) during some time period (T) can be expressed mathematically as follows:

Substituting the data contained in Figure 5.3, we obtain for the one-hour period:
The average call holding time or average call duration (D) can be expressed in terms of the total holding time ( & pound ; H i ) and the number of calls (c) as:
Because H i = C * D and, as previously noted, E = H i /T, we can express the traffic intensity (E) in terms of the number of calls, average call duration, and time period. Doing so, we obtain:
Using the data contained in Figure 5.3, we can compute the traffic intensity in erlangs as follows using a call duration expressed in minutes:
To find the traffic intensity when call duration is expressed in hours, our substitution would become:
As indicated, knowledge of the average call duration and number of calls permits the computation of traffic intensity. Because many types of network management systems, as well as access controllers, multiplexers, and computer systems, collect statistics (to include the number of calls and call duration), it is often possible to obtain traffic intensity information. Even when you cannot obtain such information directly, it is often possible to obtain information indirectly. As an example, consider a ten-position rotary connected to modems that in turn are connected to ports on a LAN access controller. If the telephone company cannot provide the required information and your organization lacks monitoring equipment, the statistics you require may be obtainable from the access controller.
5.3.3 Grade of Service
One important concept in the dimensioning process is what is known as the grade of service. To understand this concept, let us return to our intercity calling example illustrated in Figure 5.1, again assuming that 50 trunks are used to connect the telephone exchanges in each city. If a subscriber attempts to originate a call from one city to the other when all trunks are in use, that call is said to be blocked. Based on mathematical formulas, the probability of a call being blocked can be computed, given the traffic intensity and number of available trunks. The concept of determining the probability of blockage can be adapted easily to the sizing of data communications equipment.
From a logical analysis of traffic intensity, it follows that if a call is blocked, such blockage would occur during the busy hours because that is the period when the largest amount of activity occurs. Thus, telephone exchange capacity is engineered to service a portion of the busy hour traffic, the exact amount of service depending on economics as well as the political process of determining the level of service one desires to provide to customers.
You could over-dimension the route between cities and provide a trunk for every subscriber. This would ensure that a lost call could never occur and would be equivalent to providing a dial-in line for every terminal in a network. Because a 1:1 subscriber-to-trunk ratio is not economical and will result in most trunks being idle a large portion of the day, we can expect a lesser number of trunks between cities than subscribers. As the number of trunks decreases and the subscriber-to-trunk ratio correspondingly increases , we can intuitively expect some sizings to result in some call blockage. We can specify the number of calls we are willing to have blocked during the busy hour. This specification is known as the grade of service and represents the probability (P) of having a call blocked. If we specify a grade of service of 0.05 between the cities, we require a sufficient number of trunks so that only one call in 20, or five calls in every 100, will be blocked during the busy hour.
5.3.4 Route Dimensioning Parameters
To determine the number of trunks required to service a particular route, you can consider the use of several formulas. Each formula's utilization depends on the call arrival and holding time distribution, the number of traffic sources, and the handling of lost or blocked calls. Regardless of the formula employed, the resulting computation will provide the probability of call blockage or grade of service based on a given number of trunks and level of traffic intensity.
Concerning the number of traffic sources, you can consider the calling population as infinite or finite. If calls occur from a large subscriber population and subscribers tend to redial if blockage is encountered , the calling population can be considered infinite. The consideration of an infinite traffic source results in the probability of a call arrival becoming constant and does not make the call dependent on the state of traffic in the system. The two most commonly employed traffic dimensioning equations are both based on an infinite calling population.
Concerning the handling of lost calls, such calls can be considered cleared, delayed, or held. When such calls are considered held, it is assumed that the telephone subscriber, upon encountering a busy signal, immediately redials the desired party. The lost call-delayed concept assumes that each subscriber is placed in a waiting mechanism for service and forms the basis for queuing analysis. Because we can assume a service or non-service condition, we can disregard the lost call-delayed concept unless access to a network resource occurs through a data PBX or port selector that has queuing capability.
5.3.5 Traffic Dimensioning Formulas
The principal traffic dimensioning formula used in North America is based on the lost call “held concept and is commonly known as the Poisson formula. In Europe, traffic formulas are based on the assumption that a subscriber encountering a busy signal will hang up the telephone and wait a certain amount of time prior to redialing. The erlang B formula is based on this lost call-cleared concept.
EAN: 2147483647
Pages: 111