Data Flow Diagrams
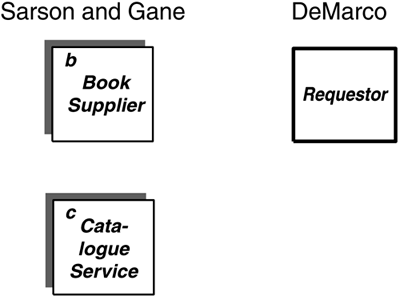
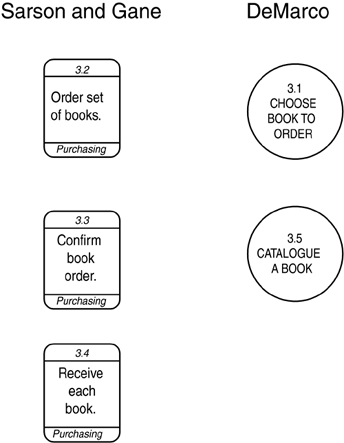
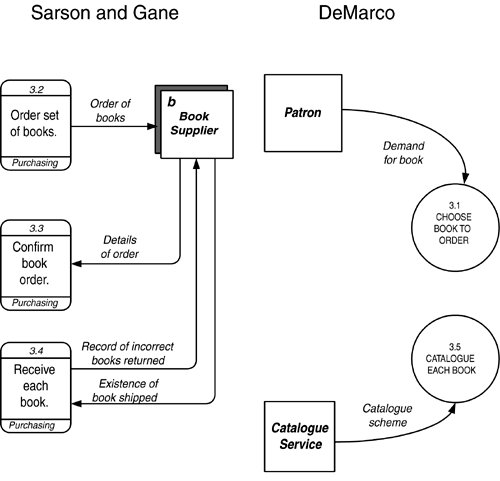
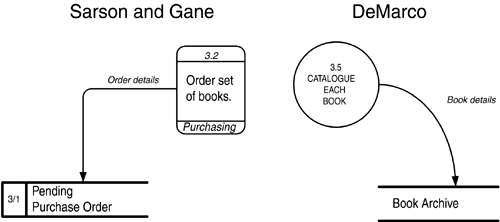
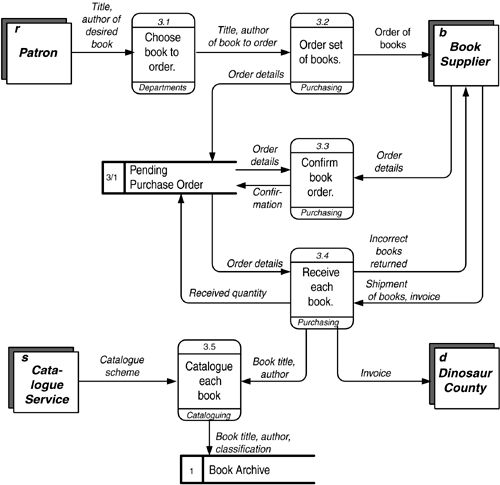
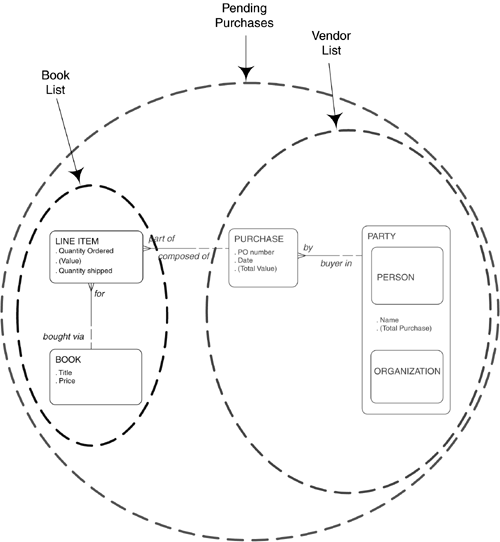
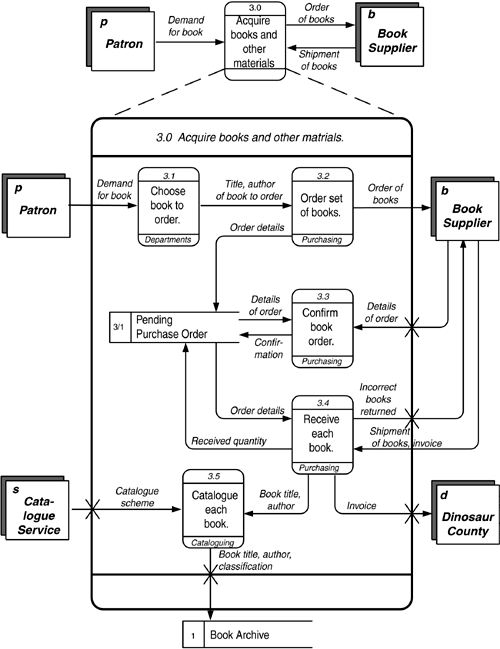
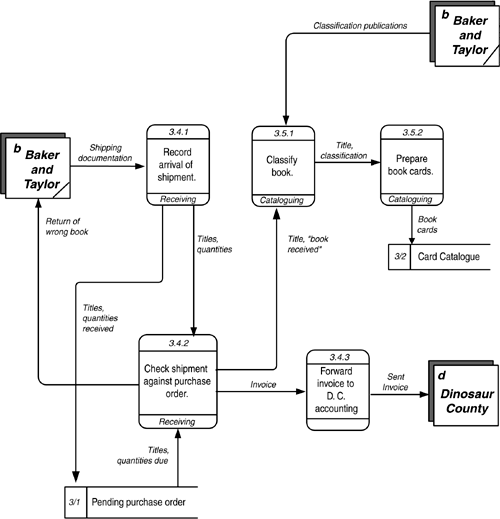
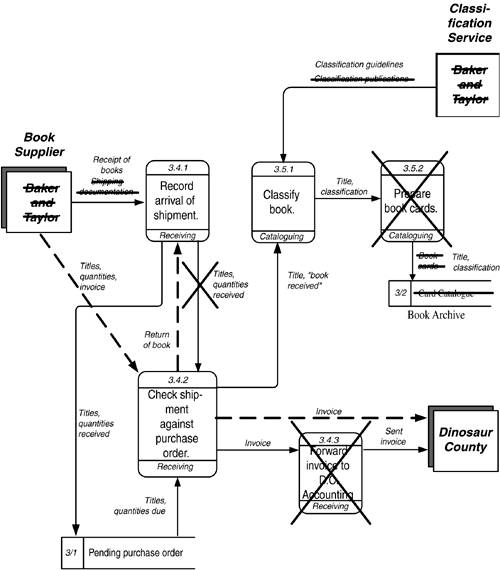
Data Flow Diagrams The data flow diagram is a specialized kind of dependency diagram. Data flow diagrams are the workhorses of requirements analysis and have been around for longer than almost any other technique. They are specifically concerned with data dependency and show this in terms of the flow of information from one activity to another. Their usefulness is limited by the facts that the nature of the flows in an enterprise changes frequently (so diagrams tend to go out of date quickly) and that many modern enterprises aren't as likely to use data in sequence, instead processing them asynchronously from some central data store. Still, it is worthwhile to understand data flow diagrams and to be able to recognize when they can be useful. Data flow diagrams were described originally by Tom DeMarco in 1978 and a year later by Trish Sarson and Chris Gane. Their different notations do essentially the same thing. Mr. DeMarco's notation seems particularly suitable when you do not have a CASE tool and must produce the diagrams by hand. Ms. Sarson's and Mr. Gane's are a little more rigorous in identifying each symbol. Because the activities of a data flow diagram are inherently sequential, they describe processes rather than functions . Still, it may be appropriate at some level to break down the function hierarchy sequentially, so that the resulting activities can be linked together in a data flow diagram. The context of a data flow diagram is defined by its external entities . An external entity is a party that supplies or consumes information. Note that within the diagram, information is neither created nor destroyed . All the information referred to there originates from one or more external entities and eventually must wind up in one or more external entities. As shown in Figure 4.7, Mr. DeMarco uses a simple box for this, while Ms. Sarson and Mr. Gane use a shadowed box. Ms. Sarson and Mr. Gane also add a one- or two-letter designator to identify the entity. Figure 4.7. External Entities. The central symbol in a data flow diagram is a process . In Ms. Sarson's and Mr. Gane's notation, this is represented by a round-cornered rectangle, as shown on the left side of Figure 4.8. It is labeled by a piece of text and a number. Optionally, it may also show the party that performs it. In Mr. DeMarco's notation it is represented by a simple circle with a textual label and a number. Typically a DeMarco diagram does not show who is doing the process. An example of this is shown on the right side of Figure 4.8. Figure 4.8. Processes. The data flow in a data flow diagram is shown by a solid arrow. In Ms. Sarson's and Mr. Gane's version the line tends to be orthogonal (left and right or up and down), with elbow bends. In Mr. DeMarco's notation it is typically curved . Figure 4.9 shows this, with Ms. Sarson's and Mr. Gane's version on the left and Mr. DeMarco's on the right. Figure 4.9. Flows. There are actually two kinds of data flows. Information is simply data passed from one process to another or between a process and a data store; a message is information that something has happened , calling for a response from the receiving process. It is an event. Messages are not stored in a data store. This distinction is not represented in the diagram, but it is important to understand if you want to understand the nature of the flows. Other modeling techniques make this explicit. The IDEF0 technique, described below, does so. Note that a data flow diagram is concerned only with data flows, not material flows. Sometimes this can be inconvenient, since the flow of material may be what the department is about. Still, the presence of material may itself be information. A good example is receiving shipped materialbut it is the information that the shipment arrived, not the material itself, that is of interest. "Existence of material received" (or simply, "receipt of material") would be the data flow. Ms. Sarson and Mr. Gane do recognize that material flow should sometimes be kept track of, and they introduce a special kind of arrow for this purpose, but it is rarely used. It is often the case that data will reside somewhere temporarily before they are used. An example is a purchase order awaiting receipt of purchased material. This is represented on a Sarson and Gane data flow diagram as an open -sided rectangle (called a data store ), or, on a DeMarco diagram, as lines above and below (or sometimes just above) text (called a file ). These are shown in Figure 4.10, again with the Sarson and Gane version on the left and the DeMarco version on the right. Figure 4.10. Data Stores. Figure 4.11 shows a complete diagram in the Sarson and Gane notation. From here on, that notation will be used in the example, since it has a slightly more rigorous system of symbol identification. Figure 4.11. A Complete Sarson and Gane Data Flow Diagram. Note, by the way, that the data shown in either flows or data stores represent an observer's view of the data. These are, in effect, views of the entities and attributes represented in the entity/relationship diagram. A view can be defined just as an SQL view would be defined, in terms of the entities and attributes it contains. It will be described by a common name , such as "payment", "order details", or some such term . The data- flow and entity models can then be linked together via the strict definition of each of these views. For example, Figure 4.12 shows a data model and the views of it that could be represented as data stores or flows. In the model, each PURCHASE must be by one and only one PARTY and from one and only one PARTY . Each PURCHASE , in turn , may be composed of one or more LINE ITEMS , each of which must be for one and only one BOOK. Figure 4.12. A Data Model and Data Stores. The derived attribute "(value)" in LINE ITEM is computed by multiplying "price" in BOOK by "quantity ordered" in LINE ITEM. This in turn is summed across all LINE ITEMS that are part of a PURCHASE to calculate "(total value)" as an attribute of PURCHASE. This in turn is summarized across all PURCHASES that are from a (vendor) PARTY to calculate "(total purchases)" from that PARTY. Similarly, "(total value)" for a BOOK is calculated as the total of "value" in LINE ITEM across all LINE ITEMS that are for the BOOK. One data-store view, then, could be "Pending Purchase Orders", from the diagrams described here. This consists of all four entities. Note that for the data flow diagram the only orders of interest were those that had a "Status" of "Pending". In fact, the view could as easily be simply "Purchase Orders". Another might be "Vendor List", showing for each vendor ( PARTY that is the seller in a PURCHASE) the total purchases for the year. This is created from the PARTY entity, but with the attribute "Total purchases" that is computed as the total of "(Total value)" from all the PURCHASES the PARTY is a vendor in . Another view is "Book List", showing for each book its total purchases. This is easily captured from the BOOK and LINE ITEM entities. "Exploding" ProcessesNote that neither the function hierarchy nor the data flow diagram shows the internal logic of a process. This must be done as separate documentation or models, as described below. (See page 187.) As with the function hierarchy, processes in a data flow diagram can be exploded into component processes. That is, one diagram may describe the fact that a process shown on a higher-level diagram is composed of six, seven, or eight smaller processes, and then another may in turn take the first of these processes and show its component six, seven or eight processes. Figure 4.13 illustrates this. Figure 4.13. Explosion of Processes. Certain rules must be followed when exploding a process:
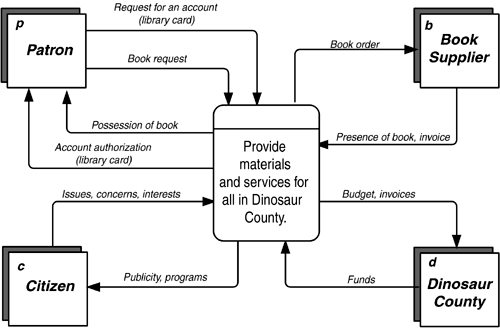
Note that manipulating diagrams and their exploded children is difficult, especially while adjustments are being made to the models. For this reason, you are well-advised to do a function hierarchy first, to get the levels sorted out, before trying to connect the functions/process to the data flows. Context DiagramCreation of a data flow diagram usually starts by creating a context diagram . This is a diagram containing only the highest-level process and the external entities with which it communicates. The process description should not be as flowery as a mission statement. Try to make it succinct. For example, The Dinosaur Public Library's mission statement (p. 149), "Provide materials and services for the information, learning, and popular reading needs for all citizens and organizations of Dinosaur County", has been reduced in Figure 4.14 to "Provide materials and services for all in Dinosaur County". This, then, is surrounded by the external entities "Patron", "Citizen", "Book Supplier", and the "Dinosaur County" government. Figure 4.14. Context Diagram. The context diagram is useful in determining the environment of the analysis and the players that will be important. It is also the basis for determining the events that will affect the enterprise and the overall body of data that will be needed. Physical Data Flow DiagramsThere are two kinds of data flow diagrams. A "physical data flow diagram" describes processes in terms of the specific physical mechanisms used to carry them out. This "as is" diagram corresponds to the Row Two perspective ("business owners ' view") of Column Two (activities) in the Architecture Framework. This shows the operation of the business in terms known to the people who do it. It is a very good way to capture what goes on and is fairly easy to do. In an interview, you ask each person, "What reports and forms do you get?", "What do you do with them?", "What reports and forms do you produce?", and "Where do you send these?" A physical process then might be "Fill out purchase order", and data flows from this process might include "yellow copy of purchase order" to "vendor", "blue copy of purchase order" to "accounting", and so forth. In the physical model, it is appropriate (indeed necessary) to identify who performs each activity. This can be the name either of an individual or of a department (or computer system). Indeed, sometimes the process itself may be no more specifically identified than "Sally's job". Here you have a link between Column Two's activities and Column Four's people and organizations. This modeling exercise can have amusing results. You complete an interview and realize that you have not heard mention of a report that another worker told you was sent to this person. When you ask about that report, you will get one of the following responses:
The assignment clearly is to make as complete and thorough a record as possible of all the physical data flows in the organization. Logical ("Essential") Data Flow DiagramsTom DeMarco described the distinction between physical and logical data flow diagrams. All he said, however, was that you should "logicalize" the model by replacing physical items with their logical equivalents. "The underlying objectives of the current operation are divorced from the methods of carrying out those objectives" [DeMarco, 1978, p. 27]. Ms. Sarson and Mr. Gane believe that you should start with a logical model in the first place. Neither of these was as clear as one could be as to exactly what constitutes a logical model and how to tell if you have one, let alone how to get from the physical model to the logical one. [2] Yes, physical mechanisms are easy enough to recognize. But how do you know if you have really captured the correct atomic-level functions at the bottom row?
Enter Stephen M. McMenamin and John Palmer. As mentioned earlier, in their 1984 book Essential Systems Analysis they describe a specific procedure for arriving at a set of "essential activities"the most basic, fully functional description of what an enterprise does. As with Mr. DeMarco, Messrs. McMenamin and Palmer believe that the place to start is to remove all references to mechanisms from processes, data flows, and data stores. An essential data flow diagram must first be technologically neutral true no matter what technology might be employed to carry out the work. This assumes instantaneous response time, no matter what is being done, and infinite storage space. Processing time and storage space are the kinds of constraints that cause current physical systems to have their sometimes peculiar characteristics, so we will assume those constraints away for purpose of identifying the essential processes. As defined earlier in the chapter, an essential activity is either a fundamental activity that performs a task that is part of the system's stated purpose, or a custodial activity that establishes and maintains the system's essential memory by acquiring and storing the information needed by the fundamental activities. Where previous authors simply advocated going from a physical data flow diagram to a "logical" one, Messrs. McMenamin and Palmer described very specific steps for identifying fundamental activities:
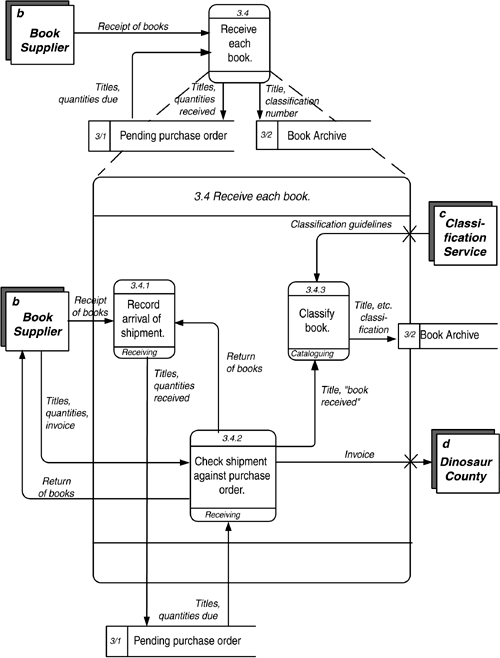
The only relevant event is "Receipt of a book", a message from the Book Supplier to "Record arrival of shipment". As it happens, all three of our fragments are performed in response to that event, so we define a parent activity, "Receive each book". This, then, is the "essential activity" shown in Figure 4.17. Figure 4.17. An Essential Activity. Notice, by the way, that "Catalogue book" has wound up as a component of "Receive each book". This was not what we originally expected when we laid out the function hierarchy and the first draft of the data flow diagram in Figure 4.13. The process of determining essential activities has revealed something to us. Now this would not be true if it were not the case that, as is currently understood , a book is catalogued as soon as it is received. If a book were not catalogued when received, then that activity would be outside the essential activity "Receive each book", just as we originally portrayed it. It may be the case that a particular fragment is used by more than one essential activity. In this case, it is appropriate to break out the fragment as its own essential activity. Note that an essential activity is the lowest level of detail at which a process (or function) can be described. Indeed it may be that these lower-level activities are the atomic ones, in terms of Barker's definition of an elementary business function or the UML's definition of an action. Those more atomic process fragments, however, that comprise an essential activity are by definition specific to the company and, at least to some extent, are bound to a technology. For example, the company could employ new bar-coding technology that would, at the same time the shipment is moved into inventory, perform the necessary checks, recording, and notification. Below the essential level, the activities are chosen by the enterprise as a mechanism for carrying out the essential business function. As a consequence, they could be changed in a new system, so they are not of concern in an analysis diagram. Above this level, you should have described functions that the company must perform, regardless of the technology used. Once the essential data flow diagram has been developed, it is possible to examine it to see what parts should be automated and how that automation should work. |
| | |
| Team-Fly |
| Top |
EAN: 2147483647
Pages: 129

