Section 3.4. State Machines and Activity Diagrams
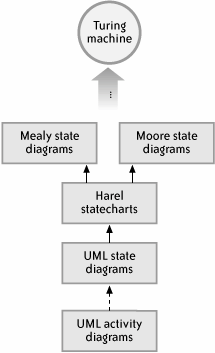
3.4. State Machines and Activity DiagramsWith its proud history and redoubtable theoretical credentials, the state machine (like the pi-calculus and the Petri net) is a guiding light to the practice of process design. As you will see, the representation of a process as a state diagram is markedly different from its more intuitive flow-chart implementation, andbeing based on a more rigorous, more expressive systemis often clearer and more compact State diagrams have a rich history. Alan Turing, the father of computer science, used the concept to build a model of computability. (See the sidebar "A Noble History...") State machine theorists Mealy, Moore, and Harel expanded the subject. Mealy and Moore built similar models whose essential differencesMealy held that actions are performed in transitions, Moore that they are performed in stateswere reconciled in Harel's later work on state charts. Harel allowed actions in both states and transitions, and enhanced the previously flat models with nested states and concurrent states. The UML state diagram, one of the leading contemporary approaches, is heavily influenced by Harel. The UML activity diagram (whose Version 2.0 specification, interestingly, uses Petri net token semantics), though essentially a flow charting technique, is in some respects a special case of the UML state diagram approach. Figure 3-13 depicts these historical milestones. Figure 3-13. State machine family tree
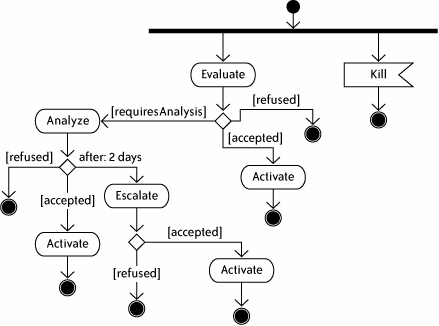
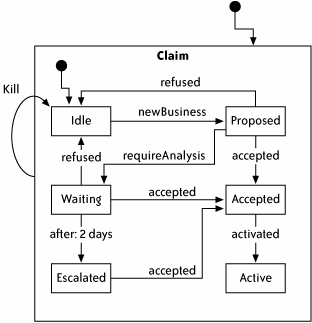
3.4.1. State Machines and Activity Diagrams in a NutshellThe flow chart, which treats a process as a succession of activities, is one of the most natural visualization of a business process. The style is that of procedural programming ; the flow chart is like a block of code run step -by step. Faced with the task of building a flow chart, most analysts simply start coding and discover their way as they go. The state-oriented approach requires more thought up front, but can lead to a clearer and more compact implementation. Because a state diagram is a visualization of the behavior of some entity, the first step is to identify that entity and to enumerate its possible ontological conditions (that is, its set of states). Next comes the conception of the set of event-triggered transitions that moves the entity from state to state, as well as the design of the corresponding actions to be performed. The result looks entirely different from a flow chart modeling the same behavior. To see how, consider Figure 3-14, which shows a flow chart, drawn as a UML activity diagram, for an insurance claims process. The shapes in the diagram are activities (rounded boxes), decision points (diamonds), transitions (arrows), the start state (solid ball), stop states (solid ball with outer circle), a fork (solid horizontal line), and a signal receiver (rectangle with V-shaped tail). The process begins by forking in two directions: one that cancels the overall process on receipt of a kill signal, the other containing the mainline processing. When a new claim enters the claims department, it must first be evaluated (the Evaluate activity), at which time it Figure 3-14. Insurance claims process as flow chart can either be refused, accepted or passed to an adjuster (based on the conditions emanating from the decision point that follows Evaluate). Refusal immediately stops the process, whereas acceptance transitions to the Activate activity, a representation of the payment and other closing claim processing steps, which upon completion stops the flow; refusal and acceptance paths occur in other places in the process, too, and they behave identically. The requiresAnalysis path leads to the Analyze activity, having three outcomes: refusal, acceptance, or the expiration of two-day timer. On expiration, the Escalation activity, a prioritized treatment of the previous analysis step, perhaps by another adjuster or a supervisor, results in one final possible refusal/acceptance decision. NOTE Two common activity diagram features not used in this example are the joina synchronization of parallel fork paths, that aren't required in this example because whichever patch completes first is meant to stop the whole flowand swim lanes , which separate a process into streams for separate participants. The modeling style here betrays a procedural programming approach, and leads naturally to the following representation in code: On signal kill, done Evaluate If refused, done Else if accepted Activate Done Else if requiresAnalysis Analyze If refused, done Else if accepted Activate Done Else if 2 day timer expired Escalate If refused, done Else if accepted Activate Done The UML state transition diagram shown in Figure 3-15, which represents the behavior of a claim, is markedly different. Figure 3-15. Insurance claims state transition diagram The diagram is hierarchical, having an outer level that consists of a single state, called Claim, shown as a large rounded box, and an inner level, contained within the Claim state, with six substates: Idle, Proposed, Waiting, Accepted, Escalated, and Active (small rounded boxes). The inner level has a start state (a solid ball) that transitions to the Idle state (the transition represented by an arrow), signifying that the Idle is the initial state of the claim. The remaining inner transitions reveal that an idle claim enters the proposed state when it arrives into the claims department as new business (the newBusiness TRansition from Idle to Proposed). It can then be either accepted (the accept transition from Proposed to Accepted), refused (the refused transition from Proposed to Idle), or deemed worthy of further analysis (the requiresAnalysis TRansition from Proposed to Waiting). Refusal, regardless of the state from which it originates, always transitions to the Idle state; acceptance, from any state, transitions to the Accepted state, which leads to the Active state when the activated event occurs. A claim requiring analysis enters the Waiting state, which is subject to a two-day timer; on expiry, the claim is moved to the Escalated state. The outer level helps model a global kill of the claim. The kill transition starts at the outer Claim state and terminates at the inner Idle state, signifying that when a kill event occurs, the claim goes Idle, regardless of its prior state. Apart from this, the outer level has no interesting behavioral features. It has just one state, which, because it is linked from the topmost start state, is the initial state of the outer level. When Claim is activated, its inner state model is initialized; the inner state is set to Idle because Idle is the initial state of the inner level. NOTE Other common UML state features include history and concurrent substates and transition guards . This example uses a declarative style. Translated into code, it resembles a listing of states and transitions, rather than an algorithm: Initial State: Claim, children=Idle,Proposed,Accepted,Active,Waiting,Escalated Initial State: Idle State: Proposed State: Accepted; on entry, assign work item Activate State: Active State: Waiting; on entry, start timer T 2 days; on exit, stop timer T State: Escalated Transition: newBusiness from Idle to Proposed; assign work item Evaluate Transition: refused from Proposed to Idle Transition: refused from Waiting to Idle Transition: refused from Escalated to Idle Transition: requiresAnalysis from Proposed to Waiting; assign work item Analyze Transition: accepted from Proposed to Accepted Transition: accepted from Waiting to Accepted Transition: accepted from Escalated to Accepted Transition: activated from Accepted to Active Transition: timer T expiry from Waiting to Escalated; assign work item Escalate Transition: kill from Claim to Idle Each listed state has a name, a list of child states, an indication of whether it is initial, and entry and exit actions. A transition has a name or trigger, start and end states, and an execution action. If the behavioral complexity increases, the changes are straightforward: graphically, add new states and transitions and possibly create new substates; in code, add new state and transition declarations, and modify some existing ones. By contrast, the corresponding flow chart would start to become unwieldy, the addition of new conditions or forks cluttering the diagram and making the generated code unreadable. 3.4.2. The Dualistic Activity Diagram: Flow Chart and State MachineThe UML activity diagram is essentially dualistic, to use philosophical language: it is by design both a flow chart and a special type of state diagram. In the previous section, you saw its flow-charting side, which, as White demonstrates,[*] is commendably expressive, with reasonable support for most of the common process patterns.
The other side is that of a state machine. UML backers position the activity diagram as a special kind of state diagram whose main steps are active states and whose arrows linking steps are triggerless transitions. But this approach is a bastardization of the idea of the state machine, argues Simons in a sharply critical paper: "The flowchart completely reverses the senses of state and transition."[*] Transitions should be legitimately event-based, and state should be determined by event reaction; if the machine is in state S1 and an event occurs that triggers transition T, which links state S1 to state S2, then the next state of the machine should be S2. But flowcharts put the logic of where to go next into the state, and the transition functions merely as a connector. Simons has a good point: how can this design claim to fit the state approach?
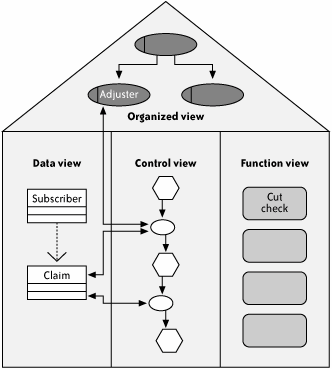
The activity diagram is much better off in the monistic form of flow chart: good as flow charts go, but lacking the clarity of the state machine. 3.4.3. State, Activity, and the StandardsUnlike the pi-calculus and the Petri net, the state machine approach has little direct influence on major BPM standards. Granted, all process languages have a strong notion of state, but not exactly that of Mealy, Moore, and Harel. Directed graph languages such as WSFL, XPDL, and WSCL, and BPEL's flow construct and WSCI's global model bears some resemblance to classical flat state machines, but the similarity is unremarkable. Activity diagrams have not gained much traction in the BPM community, which, given UML's popularity in software analysis and design, is surprising. Isn't the lure of UML enough to make the activity diagram a competitive BPM model, or at least an influencer of the leading models? It seems almost no one is building activity diagram solutions, and major BPM languages bear little resemblance to activity diagrams. 3.4.4. Event-Driven Process ChainsA flowchart approach that has enjoyed better success among practitioners is the event driven process chain (EPC). As a control flow language, EPC has different syntax and semantics than the UML activity diagram but comparable expressive power; that comparison is not explored here. What is noteworthy about EPC is its multiple-view approach. As shown in Figure 3-16, an EPC's control view can link to roles in the view of organizational hierarchy (e.g., showing where a claims adjuster, required to evaluate a claim, fits into the claim department's organization), to entities in the corporate data view (e.g., pointing to Claim and Subscriber as the main entities used in the claims process), and to interfaces in the functional view (e.g., cut check for claims payment). EPC is used in SAP R/3 workflow and ARIS, suggesting its suitability for ERP and business analysis. Figure 3-16. Four views of an event-driven process chain |
EAN: 2147483647
Pages: 122