Viewing the ADDM Reports
|
| < Day Day Up > |
|
The ADDM runs are scheduled to run automatically at the end of each Workload Repository snapshot run-so each time a snapshot is gathered, ADDM runs automatically behind the scenes, gathering information on the last 60 minutes of activity (as defined by the system snapshot interval). From the command line, the DBMS_ADVISOR API can be run to get the stored advice from ADDM. For example, the last/most recent report can be viewed directly from SQL*Plus with the following query:
SQL> set long 1000000 SQL> set pagesize 50000 SQL> column get_clob format a80 SQL>select dbms_advisor.get_task_report(task_name) as ADDM_report from dba_advisor_tasks where task_id = ( select max(t.task_id) from dba_advisor_tasks t, dba_advisor_log l where t.task_id = l.task_id and t.advisor_name = 'ADDM' and l.status = 'COMPLETED');
The output of this query will look something like this:
ADDM_REPORT ------------------------------------------------------------------------------ DETAILED ADDM REPORT FOR TASK 'ADDM:1037082046_1_198' WITH ID 310 ----------------------------------------------------------------- Analysis Period: 10-DEC-2003 from 20:30:51 to 21:00:36 Database ID/Instance: 1037082046/1 Snapshot Range: from 197 to 198 Database Time: 1119 seconds Average Database Load: .6 active sessions ~~~~~~~~~~~~~~~~~~~~~~~~~~~~~~~~~~~~~~~~~~~~~~~~~~~~~~~~~~~~~~~~~~~~~~~~~~~~~~ FINDING 1: 100% impact (7136 seconds) ------------------------------------- SQL statements were found waiting for row lock waits. RECOMMENDATION 1: Application Analysis, 100% benefit (7136 seconds) ACTION: Trace the cause of row contention in the application logic. Use given blocked SQL to identify the database objects involved. Investigate application logic involving DML on these objects. RATIONALE: The SQL statement with SQL_ID 18n2c85u5p8zf was blocked on row locks. RELEVANT OBJECT: SQL statement with SQL_ID 18n2c85u5p8zf update emp set ename = ename RATIONALE: The SQL statement with SQL_ID 275zcmg41cx02 was blocked on row locks. RELEVANT OBJECT: SQL statement with SQL_ID 275zcmg41cx02 RATIONALE: The SQL statement with SQL_ID 5dhfmtds8m5qs was blocked on row locks. RELEVANT OBJECT: SQL statement with SQL_ID 5dhfmtds8m5qs RATIONALE: The SQL statement with SQL_ID 872zuyfy72zs5 was blocked on row locks. RELEVANT OBJECT: SQL statement with SQL_ID 872zuyfy72zs5 SYMPTOMS THAT LED TO THE FINDING: Wait class "Application" was consuming significant database time. (100% impact [7136 seconds]) FINDING 2: 100% impact (1790 seconds) ------------------------------------- PL/SQL execution consumed significant database time. RECOMMENDATION 1: SQL Tuning, 100% benefit (1790 seconds) ACTION: Tune the PL/SQL block with SQL_ID fjxa1vp3yhtmr. Refer to the "Tuning PL/SQL Applications" chapter of Oracle's "PL/SQL User's Guide and Reference" RELEVANT OBJECT: SQL statement with SQL_ID fjxa1vp3yhtmr BEGIN EMD_NOTIFICATION.QUEUE_READY(:1, :2, :3); END;
ADDM and Enterprise Manager
While you can do this from the command line, as we have noted previously, it is far easier to view the latest run (and any past runs of ADDM) by using Enterprise Manager. These findings can be viewed by clicking on the Advisor Central link from the database or instance home page. This link will take you directly to the Advisors page in EM, where you will see the task name associated with the last ADDM run (if you follow the link from the database home page of a cluster database, you will see the last ADDM run for each instance). To view the same output as the above query showed, ensure that the radio button next to the task is selected, and then click View Result. On the next screen, any findings will be summarized under the section Information Findings. To view the actual report, click on the View Report button.
Viewing Past Advisor Runs By default, the reports generated as we see above are stored in the database for a period of 30 days. Therefore, if you need (or want) to review this information reactively, you can simply go back in time to view a past ADDM run, and see the advice that was dispensed along with this report. From the command line, it is possible to get this information from the DBA_ADVISOR_TASKS and DBA_ADVISOR_LOGS views, but it is a bit more difficult than the above query. The above query simply used the max(task_id) to get the latest run. If you want to get a specific ADDM run from the past, you need to know the specific task_id. Therefore, we again recommend using Enterprise Manager for this.
Again, from the EM database home page, choose Advisor Central from the Related Links section at the bottom of the page. Under Advisory Type, choose All Types, and under Advisor Runs, choose All, and then click Go. This will pull up a summary page of all advisory runs still stored in the database, with a description, the task name, and the start and end time of each run. You can now go back to a specific point in time, and view the advice dispensed by ADDM for that time period by simply clicking on the task's Name link, as shown in Figure 3-2.
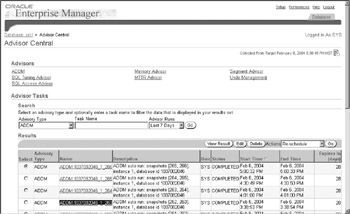
Figure 3-2: ADDM report as viewed in EM
What Drives ADDM?
So, what is the force behind the Automatic Database Diagnostic Monitor? What is it that makes ADDM generate a finding? Is it based on the mood that ADDM happens to be in when awakened after a 60-minute slumber? Is a 'finding' precipitated by a congressional investigation, or triggered by an unfounded report on a fringe web site? Fortunately, ADDM is a bit more structured than that.
ADDM uses a combination of sources for its findings and recommendations: wait events for individual sessions; the DB time model to determine how much DB time is spent in database calls, with a focus on reducing the overall database time spent on operations; wait classes, which are high-level groupings of the more fine-grained wait events; and operating system and database metrics. Using this information stored in the Workload Repository and the active session history (ASH) lays the groundwork for ADDM to make the call to report a finding, and then come up with a subsequent recommendation.
Wait Events and Active Session History
Wait events are essentially the lifeblood of diagnosing a performance problem. In past releases, if the DBA could capture a problem while it was occurring, they could go into the V$SESSION_WAIT view and determine what it was that sessions were waiting on. This would give him or her the impetus to then move forward in resolving the issue. If we missed the event, however, we would have to either rerun it (somehow) or rely on information from StatsPack (or AWR) on what the top wait events were for that period, and make the leap of faith that these waits were corresponding to what our particular problem was. With Oracle Database 10g, there is a new view introduced called V$ACTIVE_SESSION_HISTORY, which maintains data from active sessions, capturing the wait events and their wait times, the SQL_ID, and session information for the waiting session. This allows us to then go back to the past and view this detailed information as it existed in the past. ADDM can use this for proactive and reactive analysis purposes. In addition, the view V$SESSION_WAIT_HISTORY will provide the last 10 wait events for an active session.
Wait Classes With Oracle Database 10g, there are now over 700 wait events, primarily due to the fact that many previous wait events have been broken down into more granular events to make diagnostics more precise. To make these wait events easier to interpret, they are categorized into wait classes, with each wait class pointing to a high-level category of problem for a particular wait event. Each wait event is assigned to a specific wait class, with the wait class pointing toward the problem and solution. The most common wait classes and their descriptions are listed here:
-
Administrative Commands issued by a privileged user (that is, DBA) that result in other users waiting-an index rebuild, for example.
-
Application Generally related to application design, this category includes lock waits caused by row-level locking and explicit or implicit lock commands (implicit lock commands such as those generated by a DDL statement).
-
Cluster Global cache, global enqueue, and global messaging-related wait events in a RAC environment.
-
Commit Currently only includes a wait event for redo log sync confirmation after a commit.
-
Concurrency Generally, waits involving concurrent parsing and buffer cache latch and lock contention; indicative of many sessions going after the same resources.
-
Configuration Wait events in this category can generally be resolved by tuning; includes undersized log buffer space, logfile sizes, buffer cache size, shared pool size, ITL allocation, HW enqueue contention, ST enqueue contention, and so on.
-
Idle Session is inactive.
-
Other Catchall for wait events not associated with one of the predefined classes.
-
Network Waits for data to be sent over the network-specifically waits in the networking layer or on hardware.
-
Scheduler Waits due to Resource Manager prioritization.
-
System I/O Waits on I/O done by background processes (except for MMON and SMON).
-
User I/O Wait for blocks to be read off disk by foreground process, SMON, or MMON.
The DB Time Model
The DB time model is a way of looking at performance based on the overall time spent in the database. Time-based statistics are kept in two new views in Oracle Database 10g-V$SYS_TIME_MODEL and V$SESS_TIME_MODEL. While these views contain various different time-related stats, the most significant of these is DB time. The goal of any tuning activity should be to reduce that overall time. If the overall time spent in the database, in database calls, is reduced, then the tuning has been effective. ADDM will use the DB time model as a basis for findings and recommendations. In addition, automatic tuning of the SGA (discussed later in this chapter, in 'Memory Advisor and ASMM') will take DB time into consideration when deciding where to allocate SGA resources, with the goal being to reduce overall DB time.
|
| < Day Day Up > |
|
EAN: N/A
Pages: 134